It’s been asked for a few times and is somewhere on David’s to do list.
An old thread: Normalised power-duration curve? - #3
It’s been asked for a few times and is somewhere on David’s to do list.
An old thread: Normalised power-duration curve? - #3
Hi David, how is this feature coming along?
even if its not a full curve (it doesn’t make sense for less than 20min), it could be a hard coded record of PR’s
20min
30min
60min
90min
2h
3h
4h
5h
Thanks
wonder what has happened with this. thanks
+1 would love to see this feature, more relevant outdoors particularly for people in hilly or high-traffic areas
+1. This is still one of the features that keeps me going back to the training platform I used before. We’re all aware of the limitations and debates around the concept of normalized power, but it’s always useful to put race efforts and fast group rides into perspective compared to the athlete’s own history.
Would be really nice.
Can add just a little more analysis tooling for stocastic diciplines.
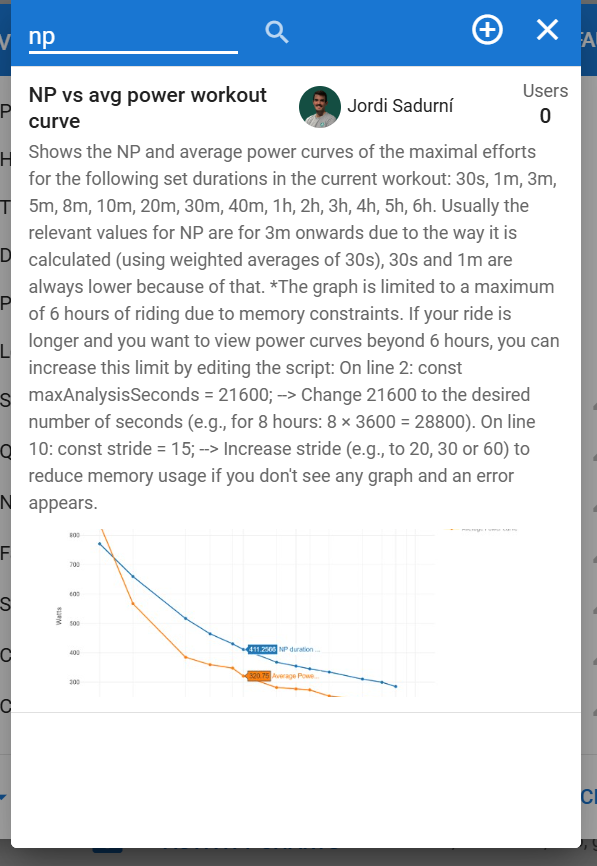
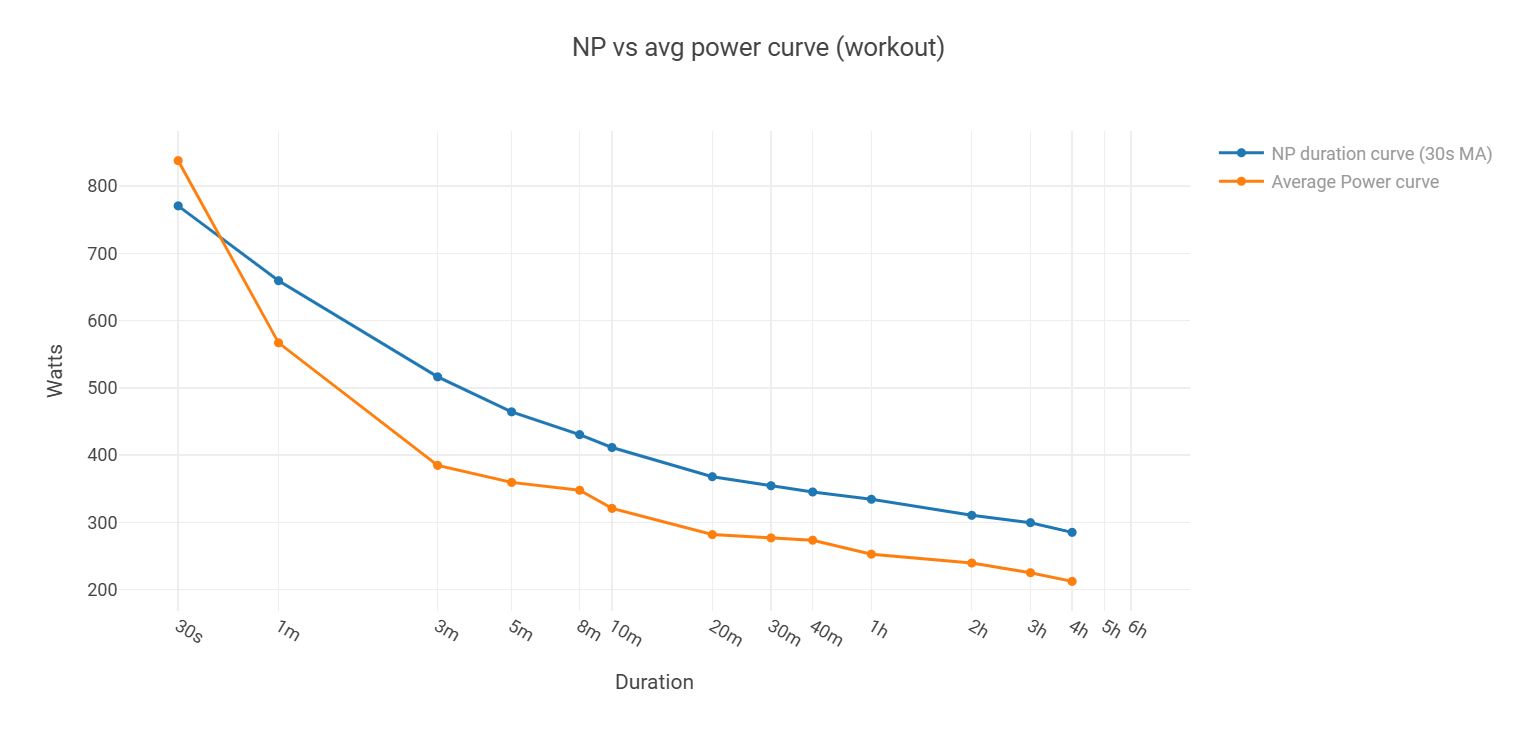
Hello I’ve just coded a graph to see the NP curve for a workout and made it public if you are interested you can find it looking for this on the activity charts (power section of a workout): np vs avg power workout curve. Should be open to everyone, tell me if you want it and can’t find it!
this is cool, but can it be done looking at the historical, by years or seasons like in the Power page?..or this is just for one activity? Thanks
I don’t know how to do it. I guess I would need to be implemented in the power section of intervals. Because I think inside an activity you can’t save historic data. I guess @david will have to check if it’s possible
@Jordi_Sadurni discovered your “NP vs avg…” but can´t find it somewhere, can you help me getting it?
agree here with this feature, makes totally sense.
maybe an idea is to use existing power-curve and make this kind of a configuration that for 20min + effort the NP is being taken. @david
You have to search in “Activity Charts”
This code is giving me some weird numbers. For one activity, for example, it shows 290 NP for the 20’, but the real value is 240. Same with the average power: the actual average is 205, but I’m seeing 190.
Ok, could be an error in the code then, I’ll check that when I have a moment, thanks for the feedback!
As R2Tom said you have to open an activity, go to the power tab and then at the bottom of the page press on "Activity Charts”, once there paste this: NP vs avg power workout curve
As long as Jordi’s contribution looks fine and does the job for an activity analysis, I would like to highlight that one of the key uses of a normalized power curve is comparing different stochastic efforts, i.e., different activities (specially like races, fast group rides, etc).
So I’d like to stress that this is still a request.
Yeah, I think the NP curve and the Heart Rate curve are two ‘priority’ features to add for analysis. These, along with the ability to have ‘best efforts’ for W/kg and not just for absolute watts (you can change the curve but not the table with the best efforts), would be great additions