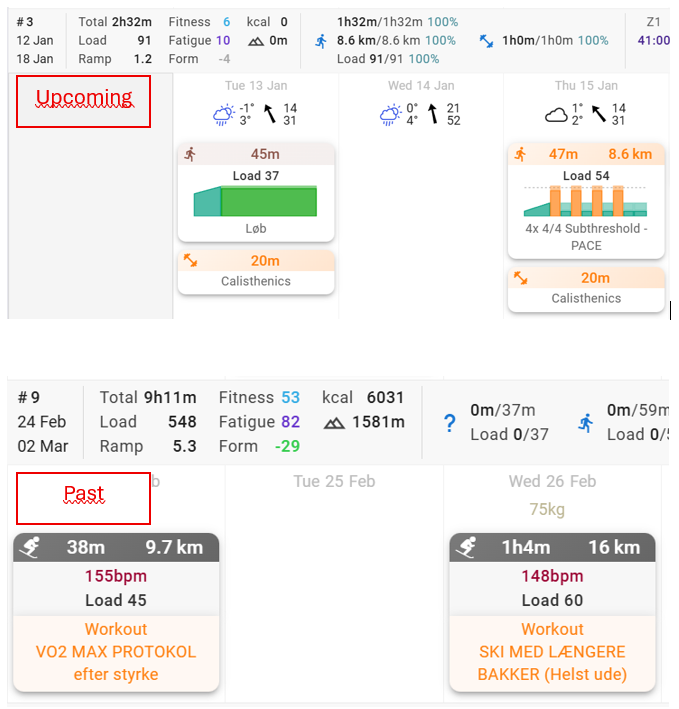
I would like to see past workouts in the format you get as default for upcoming workouts. It is the visuals for upcoming workouts I need across a timeperiod. Is it possible to adjust for all past workouts?
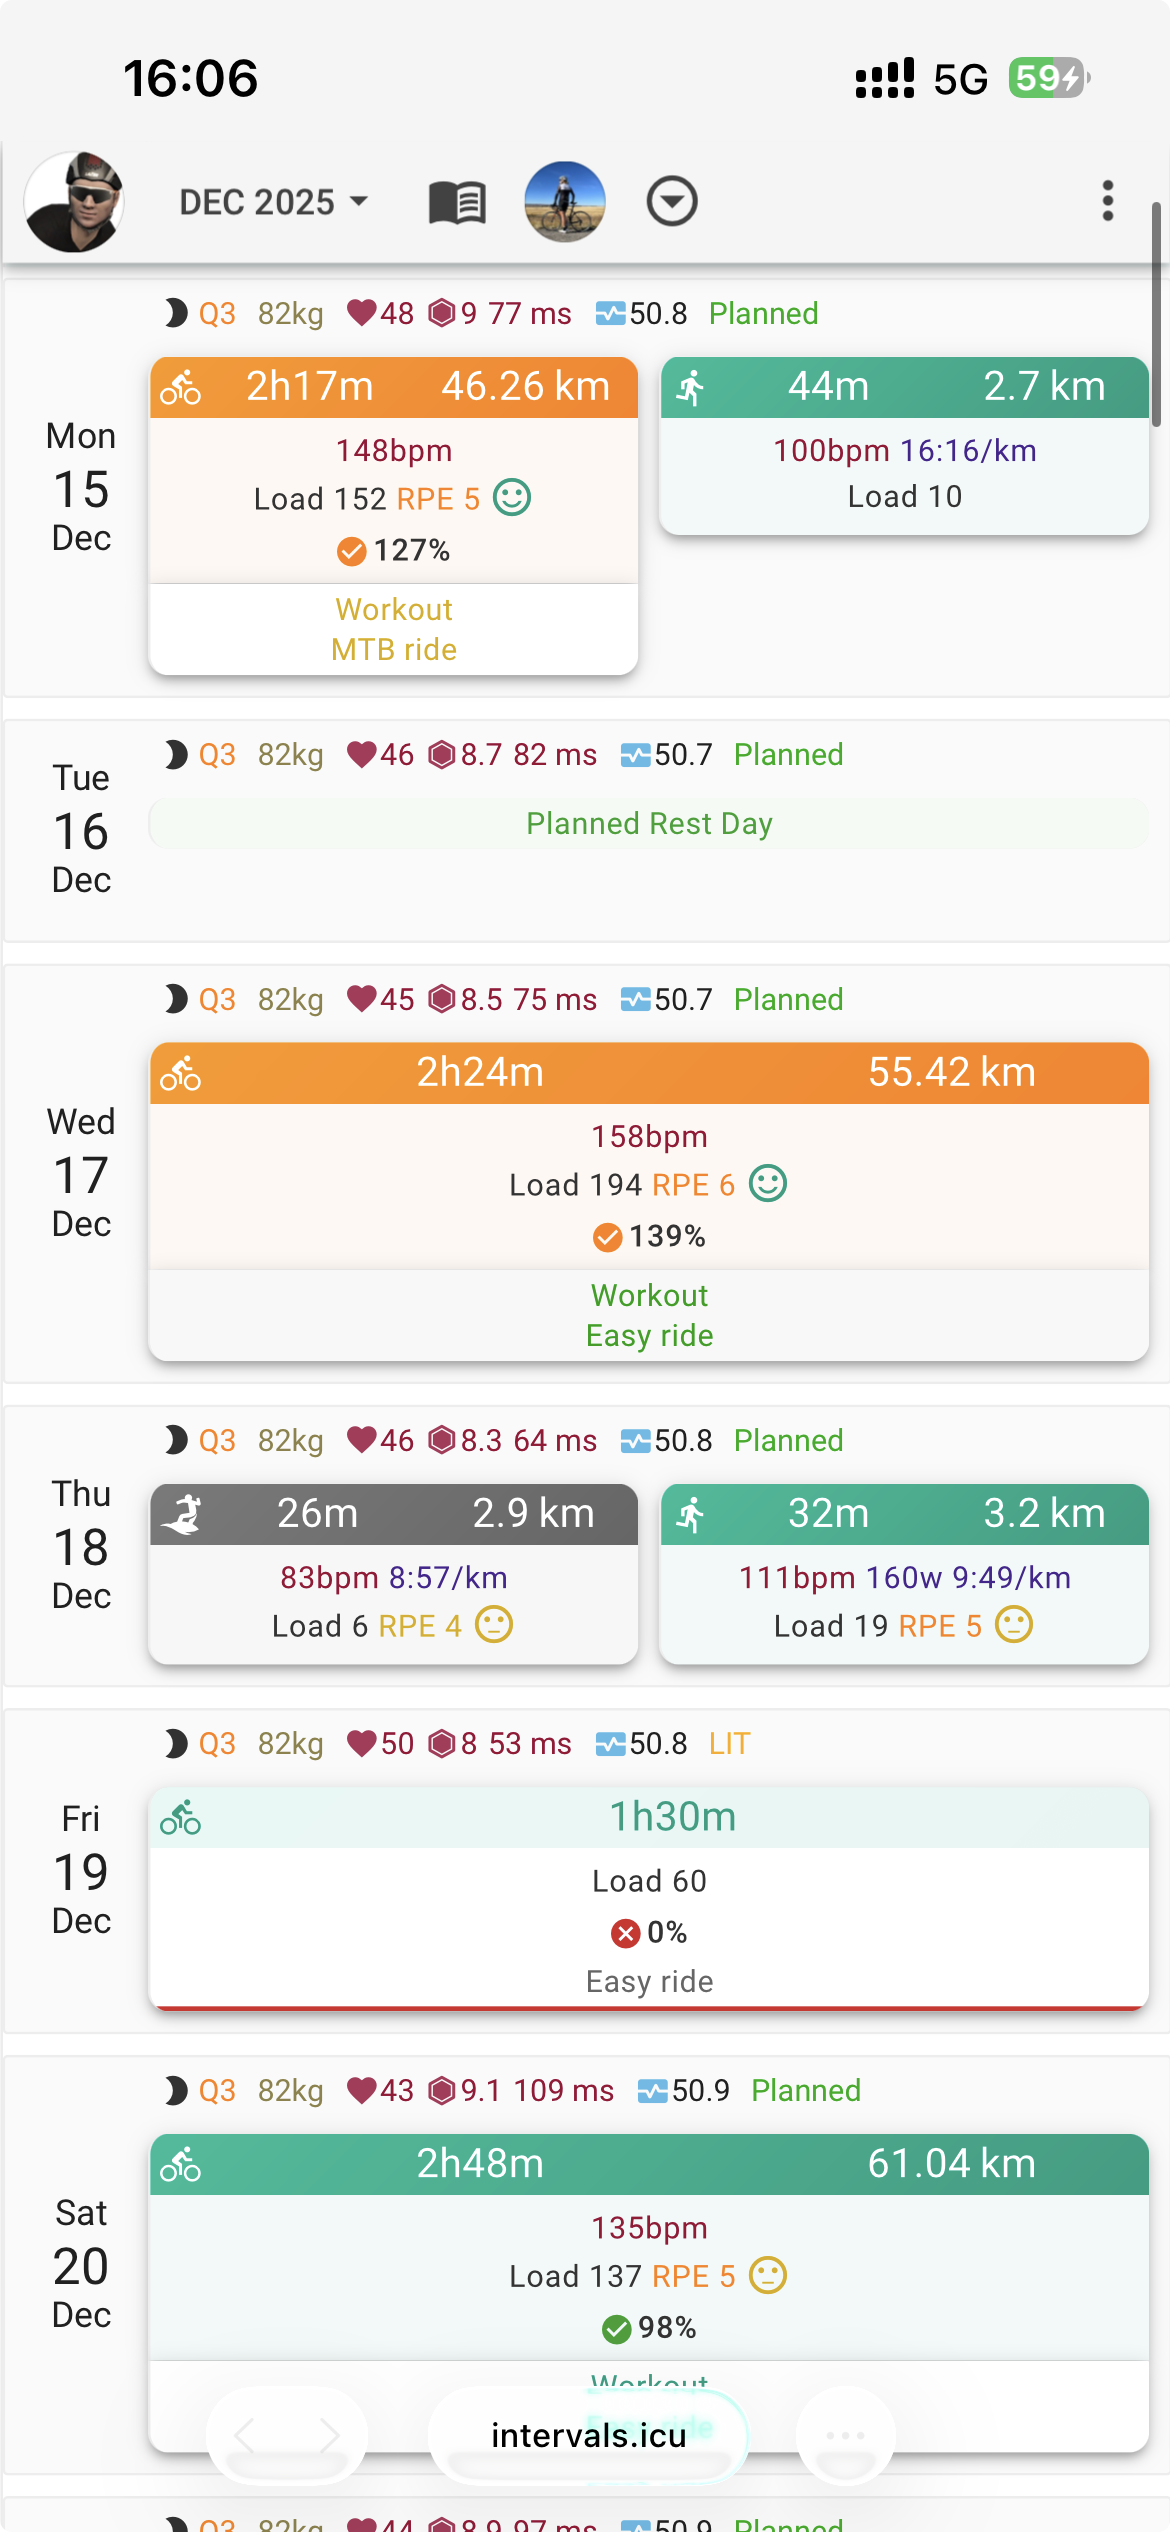
With the steps, I was able to produce the planned chart - see picture.
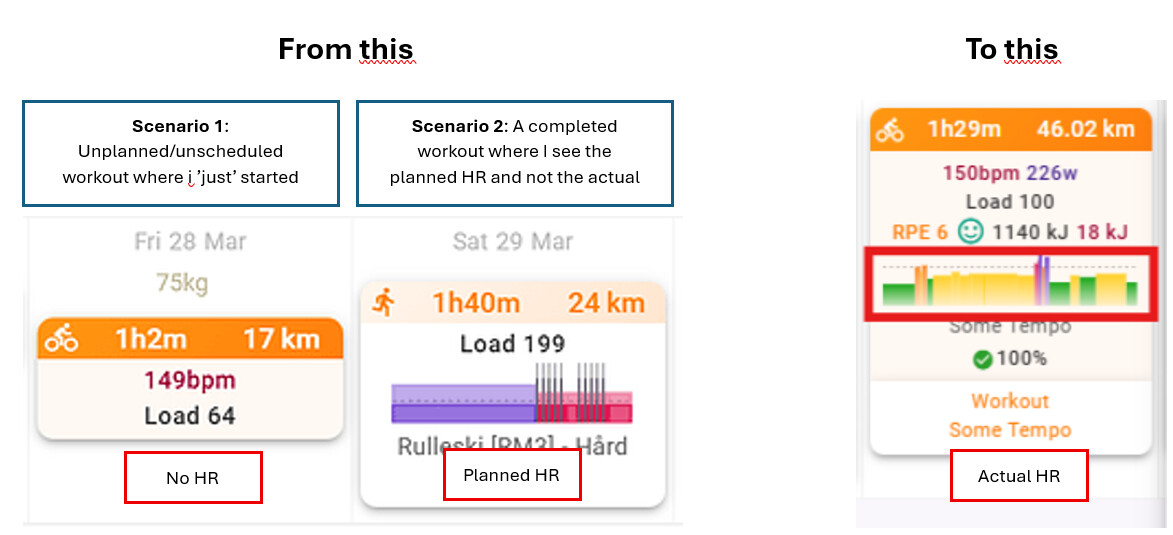
How do I change it to the actual HR chart like you have? With my current setup I don’t see a HR chart for unplanned workout like on the friday in the picture.
I hope I understand what you are asking.
You want to see a skyline image of an “unplanned” workout? What does “unplanned” mean? Is that zero steps for the workout and just a total load/duration?
Perhaps share a screenshot of the Friday workout. Click on the orange block to open the editor.
I’ve tried to explain it with a few combined screenshots. Ultimately, I would like to see the actual HR that you see in your plan and not the scheduled workout HR I see in mine.
Nice catch. It did update some of the data to Planned HR data (see screenshot). However, I am still unable to see Actual HR data (see screenshot). Any ideas?
I don’t have planned HR showing, and not sure that is possible at the moment.
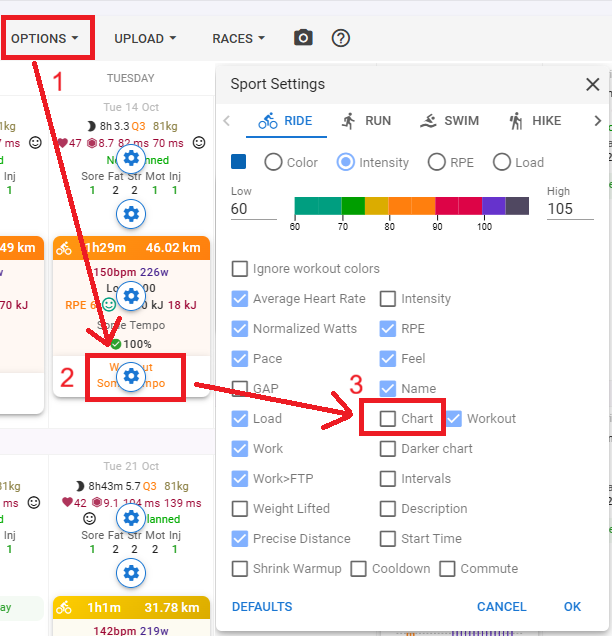
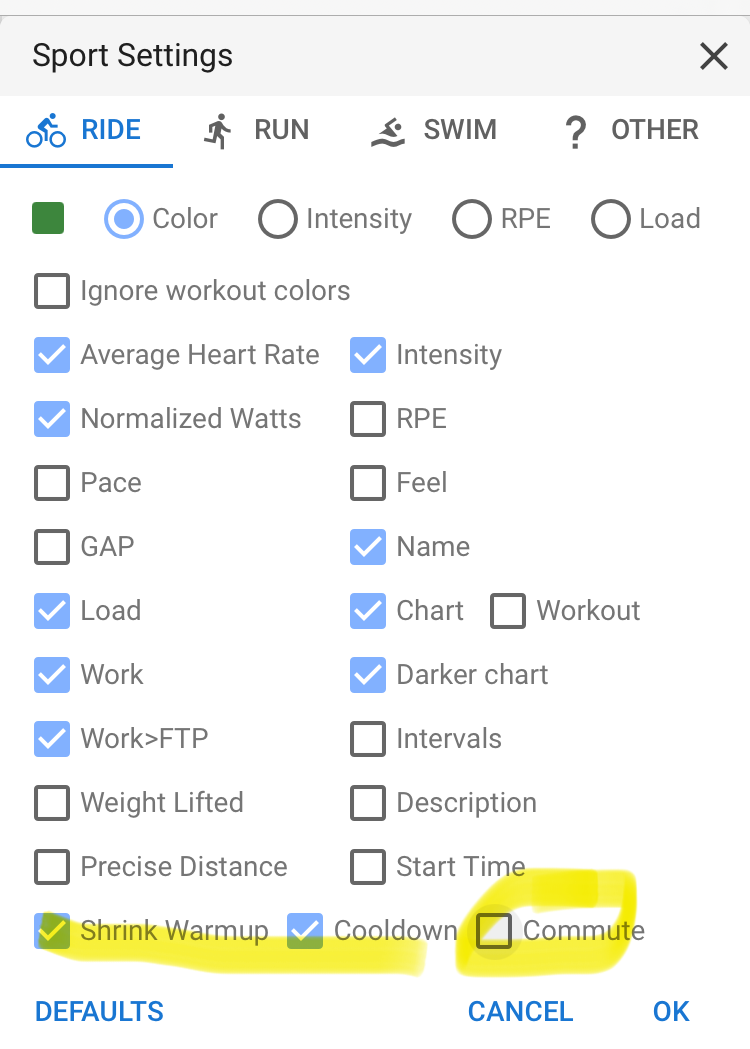
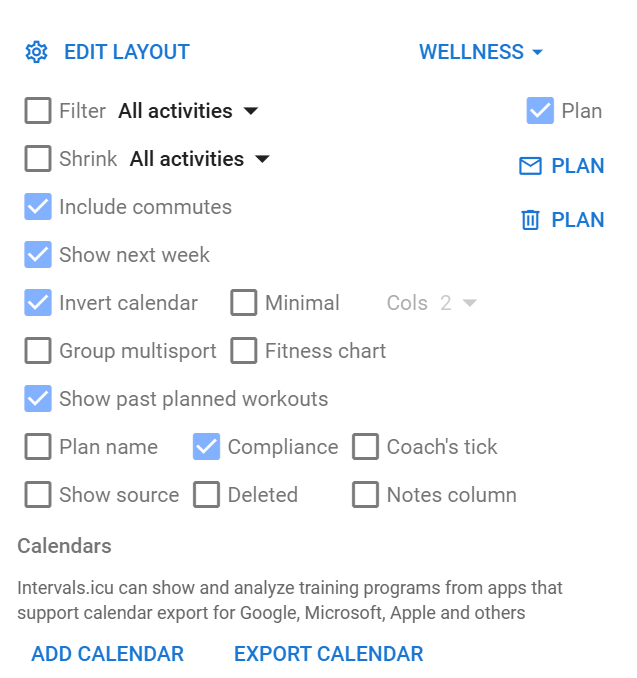
To view actual HR, it’s in the edit layout that @R2Tom mentioned, called Average Heart Rate
The tick boxes are metrics/fields you can see on the calendar.
Sorry for the late reply. I have been away on holiday.
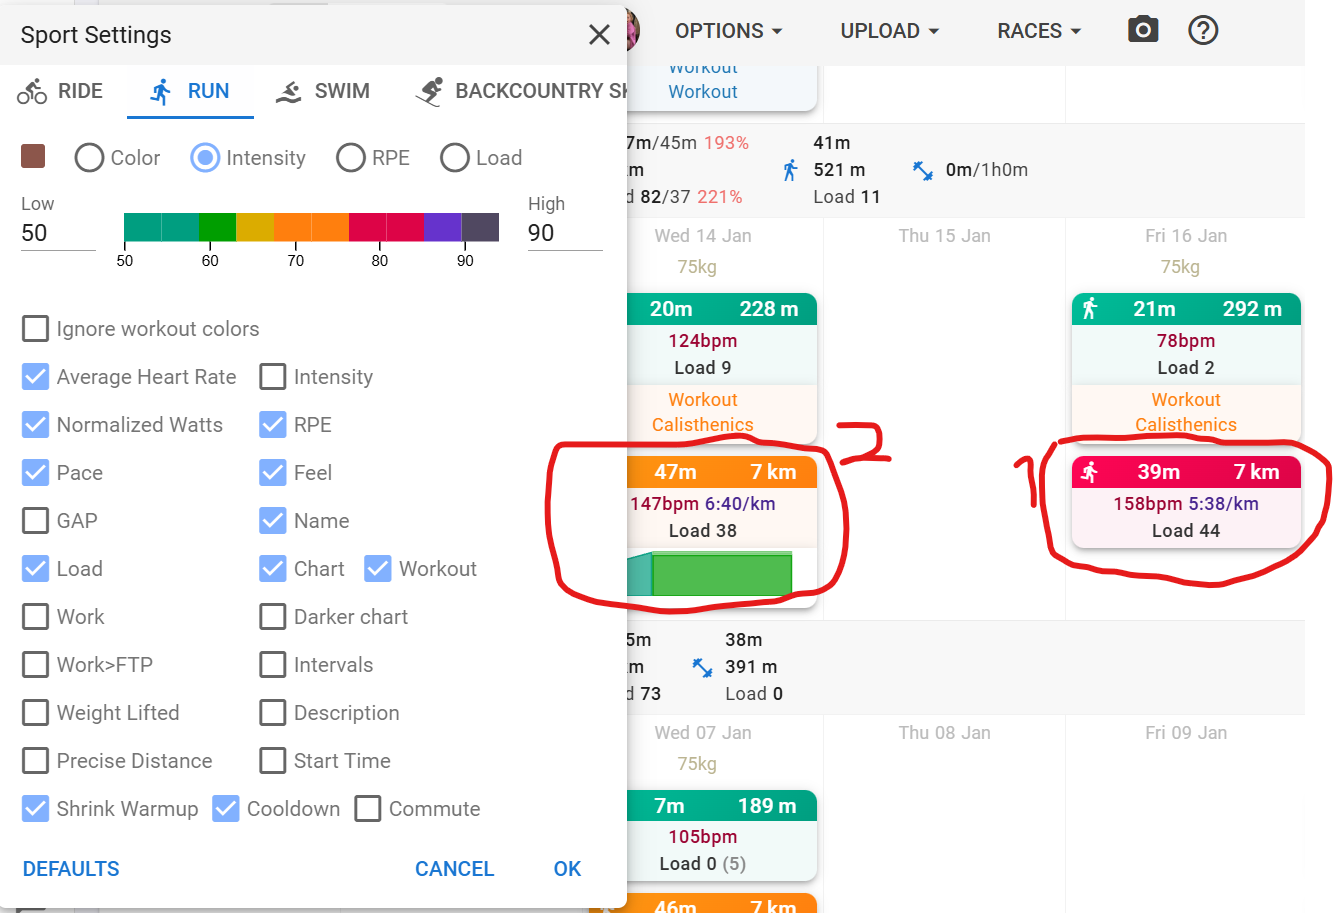
I’ve tried removing the tick at Commiute but I still do not see Actual HR for my runs.
For workout highlighted as #1 there was no scheduled workout and I don’t see the actual HR. For #2 I only see the scheduled workout HR.
I’ve included the RUN sport settings in the screenshot. I’ve alternated the “Chart” tick and “Workout” tick. I don’t see a combination that shows the actual HR data.
I can’t see where there could be a problem. All my workouts (ride and run) both show HR when the average heart rate is ticked, and doesn’t show when unticked.
My last few runs (December) don’t have a planned workout associated with the workout, and there are no intervals listed.
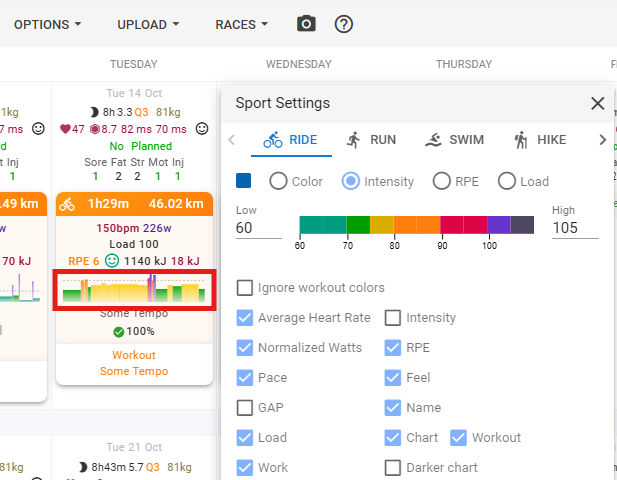
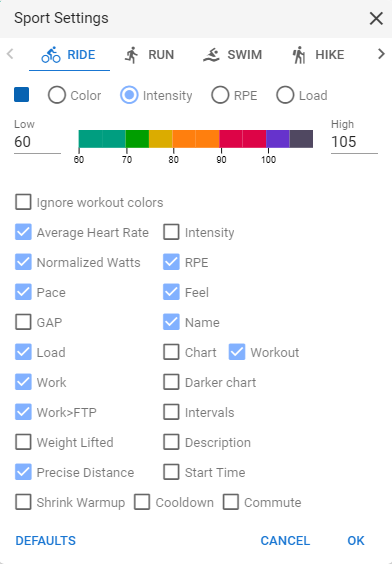
I’ve been looking more into the overall options - going from ticking the “Minimal” to unticking it. A screenshot is included.
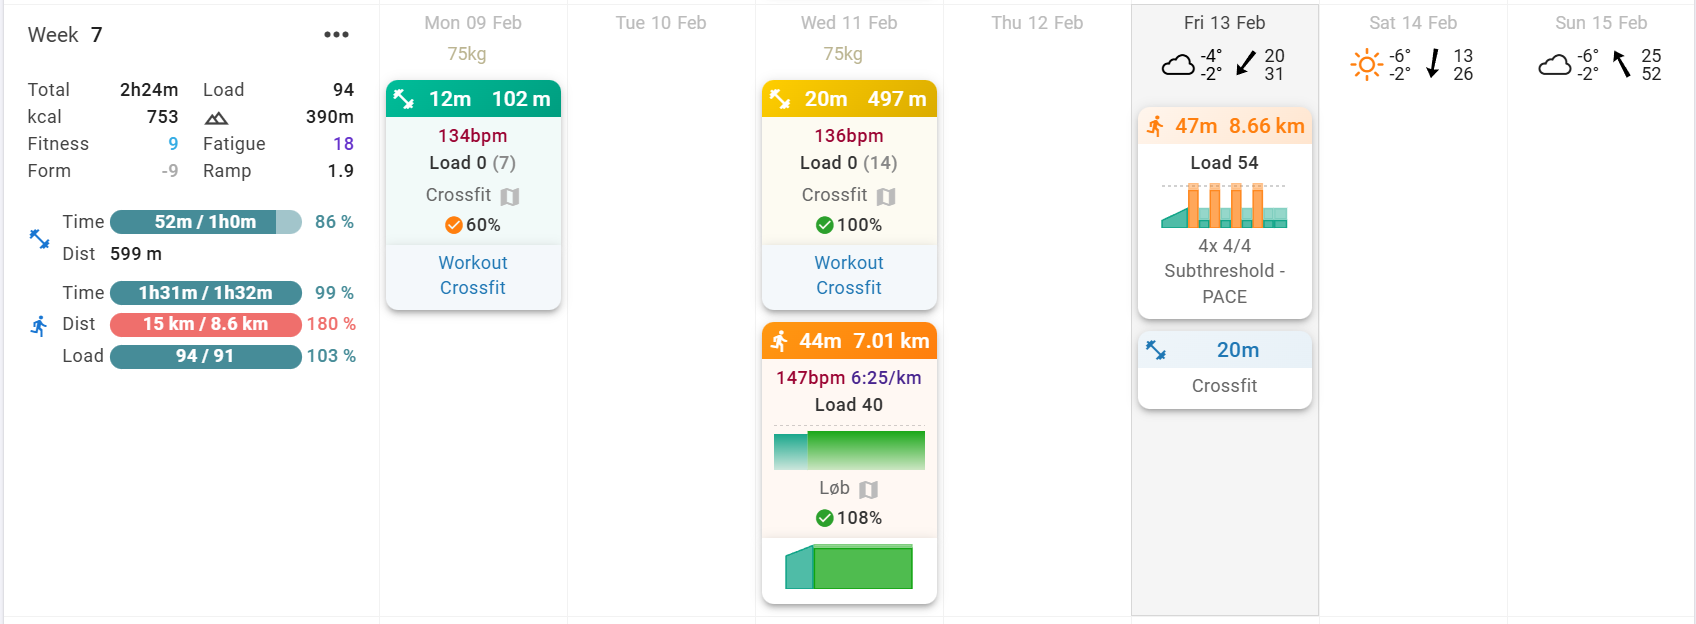
I now get a second graph with the actual HR but it is either one straight line with avg. HR across the whole duration or tied to the durations of the interval segments as visible on the included screenshot for the workout on February 11. Any way to break this up into selfsorted durations or preset increments just like the Skyline chart you shared on 12 Jan, @Gerald?
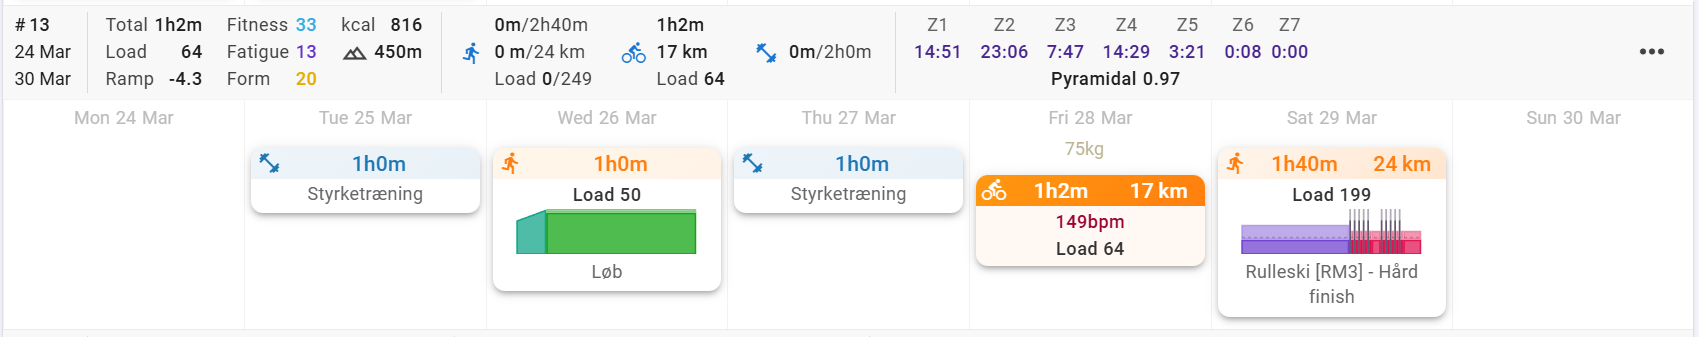
For a planned workout, the skyline is created from the planned intervals (duration and intensity).
For an activity, it’s the same, but then from the performed efforts. If you have no intervals, the skyline simply shows the average for the entire activity.
An activity, performed following a planned workout, and with correctly registered lap events (=intervals), will show something very similar for both skylines.