Hi David,
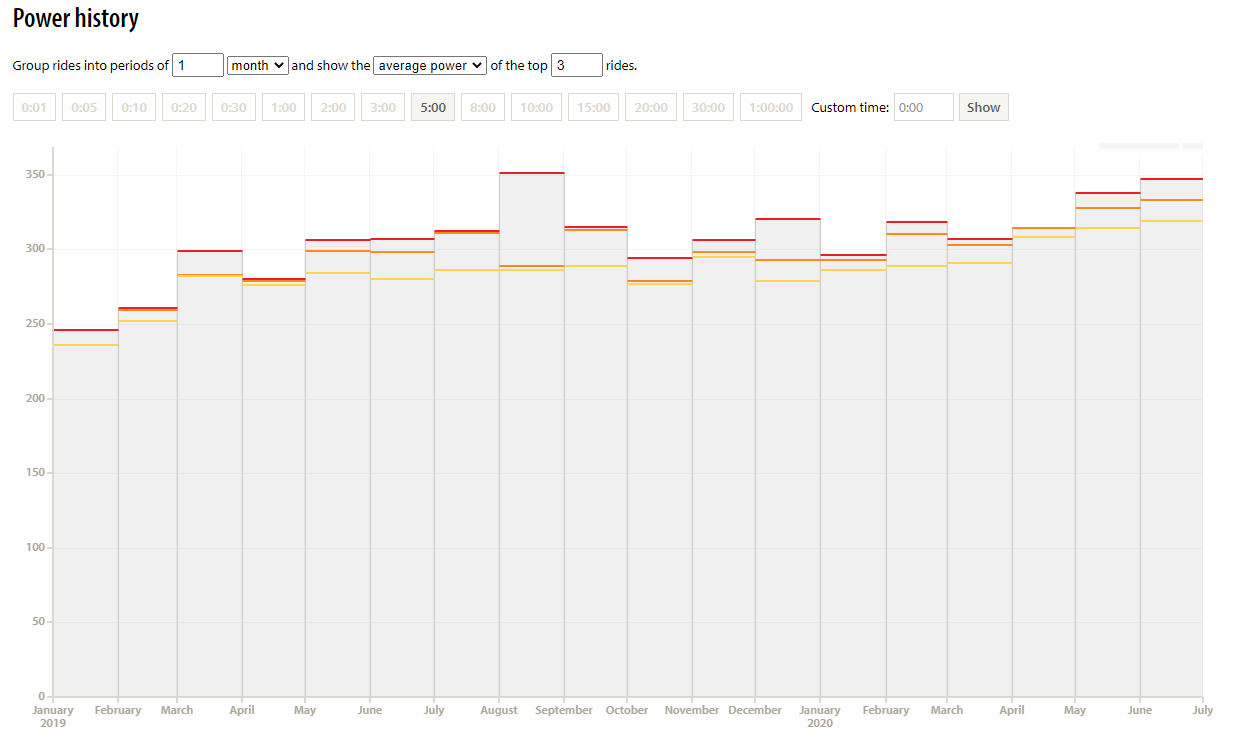
The screen below is taken from one of your competitor (CyclingAnalytics).
This is a feature allowing each one to see the x average power/effective power (3 per default) per period (day/week/month/year) on a defined period.
We can get the information from 1 seconds to 1 hour, and also select a custom time.
It is very useful to see the progression.
Would be amazing if you can include such functionality in your roadmap!
Many thanks in advance,
Martial