AlphaHRV does not duplicate respiration rate, as I said the measurements are totally on par with Movesense, it is not worth counting breaths as you do.
As for DFA-alpha-1 I think you do not have the concept very clear, the standard DFA=0.75 is used for first threshold and DFA=0.5 as second threshold, after more than 100 tests we have done, we can say that these values are valid for some and not for others, I do not think that any coach uses 2mmol for first threshold and 4 mmol for second using lactate. Besides in that image you have not calculated the linear regression and eliminated the part at the beginning, besides you have to change some parameters in Runalyze for that regression to work “well”. We stopped testing thresholds with DFA because first the test has to be very well done because it is affected by any movement, depending on the type of test is more reactive and finally with covid those DFA values have changed in many athletes, although there is scientific evidence I guarantee that not all have the thresholds in the “standard” values.
I have done some more testing with the latest version. An important thing to always remember is that the results for a1 and resp rate are always the average of a longer measurement window. For AlphaHRV, the window is 200 beats if I remember correctly. So if you want to verify a stable resp rate by counting your breaths, you should do that for at least 2 min and then compare to the result of the algorithm. It’s not quite instantaneous…
Not exactly. Data window for a1 and RR are not the same length. For a1, D=200 beats is the default value (configurable for some devices going into developer mode).
For RR calculation, default window is T=60s. You can modify this value, being limited by the beats selected for a1: (T/60)xHR<D
But you are right, a1 and RR are not instantaneous metrics, but average for some period
-used 6min protocol
-wahoo ticr with garmin epix watch
-ant+ - alphahrv; bt - garmiin epix been
-wahoo core trainer
i think my results are totally wrong
but my question is,:
-at the beggining there is a countdown from zero to 100%. Have impression it is a base setup. What should i do during this countdown? sit relaxed, ride slowly, or start first step of the protocol?
-what should the artefacts show? what is a correct reading and what reading is wrong? my chart is just empty
-is there any difference between ant+ and bt? Should I use one over another to get better results?
In two days i will try again, so jope this time my reading will be batter
alpha-1 and RR in that chart are not good. Good quality RR-intervals data are required for this analysis, that probably your HRM is not providing. If you share the fit file I can check it.
Regarding your questions:
DFA analysis requires an amount of data to be carried out. The count to 100% referes to initial collection of data. Reaching 100% means that the app has enough RR data to start calculations. You can do what you want during this period, but you won`t have any alpha1 nor RespRate for that period, so I recommend not to start the test before 100% is reached
Artefacts (wrong data received from the HRM) should be as low as possible. It is assumed that >5% seriously affects alpha-1 calculation
ANT+ and BLE are equivalent and you should get same results regardless the communication protocol you select. However, if you want to natively save HRV in your device for further analysis in external soft (runalyze, aiendurance, …) you must take into account that Garmin uses ANT+ in a wrong way for that purpose. So, in that case, I recommend to use ANT+ for alphaHRV and BLE for the device
I did another test with same result (so no point bothering you with fit file) but after that I switched to ble connection and there are some diferences:
not sure why but it takes much longer to get 100% (like 3x longer)
-too tired to make another test today but readings are much lower alpha-1: 0.70 when resting
-tomorrow will try again but probably need to get anothe betterr strap
In Excel, my simplistic approach using the limited mathematical knowledge I have, would be to extract the 2 sections of data where the curve is linear. Section A-B and C-D in the graph.
Filter that extracted data for outliers using some sort of Std Dev filter. Then let Excel determine a trendline for both sections. From the trendline formula’s, calculate the intercept.
You should be able to get in the ballpark but this method will not give a consistent result simply because another person might draw the lines a bit differently….
This is basically the procedure. However, in excel you must select manually the range of data for each linear regression as it only allows single linear regressions. So, results can be affected by the user selection, especially when both areas are not clearly defined, as you remark. alphaHRV desktop automatically provides the best bilinear regression with no need to split the data. It is still under development, but giving nice results
I know, the only thing is that we are doing a lot of tests and we have to get something that is valid, although it will probably need some interpretation by the coach, the problem we have in Spain is that we do not have any help and we are paying for everything from our own resources so everything goes slower, I have to do lactate, you know that the test strips are not cheap, then I transfer everything to Iñigo and he starts to refine everything, we meet, we talk about the results, we test again and so we are all day. Spain is different
Truly understand this situation.. same w/ me on developing the BreakAway: Indoor Training app. Worst is I need to sit on the trainer most times when I make a trainer related change as some parameters can’t be simulated. (like HR variations and having that control the trainer)
As an aside, i thought that using DFA-a1 for training was prev marked as not so “applicable”, but seems like you guys are really going into it w/ lab tests and all that.
I have tried it previously and I’m not certain it’s useful for me as the data that came out looked “suspect” to me.
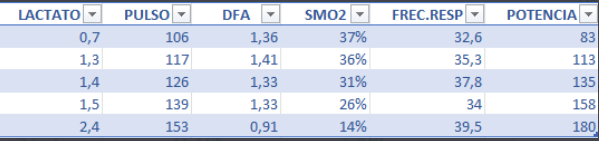
We know that the standard values of 0.75 for AeT and 0.5 for AT are not valid for many athletes, with this we are trying to show that we have personalized values of DFA-Alpha-1, in my case tested with lactate and respiratory rate is AeT= 1.00 DFA so the value of 0.75 doesn’t make any sense to me (before covid my AeT was 0.75, tested with lactate too), we encountered this problem but tried to solve it by looking for a custom range, the tests are very exciting . Imagine that we extract a custom value in a work range of AeT (80-100% of AeT) and assign a DFA value to 80% and one to 100%, if we graph the sessions at the beginning we will see which day is placed in those values and the average of dfa will be within that value, after several weeks we will verify that the value of dfa has changed by increasing its value, which means that we have improved. Imagine that one day you do a session and DFA drops more than necessary, we know that something is happening (illness, tiredness, etc…) This is the approach we are giving to DFA and respiratory rate.