I’ve been looking into my Polarization and the PI of my workouts, it seems if I plug in a simple “dots” type graph of “PI” it shows only positive values.
Y axis:
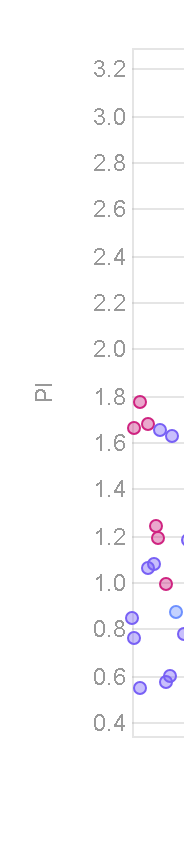
Some of the PI column for my activities:
I don’t have any activity filters or anything on this, and configured it to show for my last year or two, so I expect the Y axis to go a bit lower than the 0.4 here.
The settings of the graph: