I recently went to a local lab and had a Vo2Max test on a treadmill.
I now have my baseline number of 48.3 (age 54) but i don’t know what to do with this value.
I can find all sorts of articles on the value of having a high VO2Max but nothing that tells me what to do with the number in order to more effectively shape my training.
I was hoping to get VT numbers along with the result but no luck. They gave me HR zones but these were broken into 4 zones not 5: low, (102-119) moderate (119-136), high (136-153) and peak (153-170) and i don’t know how to map these into a 5 zone Coogan or 3 zone VT based model.
170 MHR was a value I provided based on memory of a peak data point seen in the last 30 days not an output of the test. I did not run to failure. The test was stopped at a bit over 20min when they reported that my VO2 value hadn’t moved for a couple minutes. Highest HR registered was 160.
They also gave me an anaerobic threshold VO2 of 39.3 at a HR of 140.
I’d like to update my HR training zones based on these inputs but not quite sure what to do.
Any help would be appreciated.
There are a few things you can do with the VO2 numbers…and this would apply to running and not really to cycling.
First, VO2max is just a value. It doesn’t describe anything except for the max value of oxygen consumed. Lots of other factors dictate how well you convert that O2 to speed, like running economy, what %VO2 you reach threshold, etc. It would be more helpful to have paces (or better yet, power) associated with VO2 utilization, rather than heartrate. The we can make better regressions.
From your test values, you can use your Vo2Max of 48 to determine paces with VDOT, or other systems that are based on VO2max. If you have recent race times or time trial results, you can do some modeling to see if your estimated VO2max correlates with your measured VO2max.
Since you received an estimate of threshold at 38 ml/min/kg, your threshold is approximately %81 percent of VO2max. You can work on improving threshold since you have room, e.g. raising threshold to 85-90% VO2max. You can also use training systems based on threshold, if you choose.
For zones, the threshold and VO2max values can be used as the top of Zone 4 and Zone 5, respectively in the Coggan system. You’ll still need to work out your lower threshold (VT1, LT1) for the top of Zone 2. In a three zone system, your threshold estimate is the top of Zone 2 and VO2max is top of Zone 3. You still have to estimate or measure VT1, LT1 for the top of Zone 1.
All that said, your test results really only apply to treadmill running. Your HR and paces will be somewhat different once you step outside.
2 Likes
Thanks for the feedback.
That’s very helpful
It is important to note that the VO2max for running differs from the VO2max for cycling and cannot be interchanged. As you conducted your test on a treadmill, your VO2max value is specific to running only.
If you want to know your Coggan zones for cycling you basically have three options:
Option 1: Perform an FTP or ramp test on your bike with a power meter. This test may not be very accurate.
Option 2: Undergo a lactate test to model your lactate curve or a load test in oxygen mask.
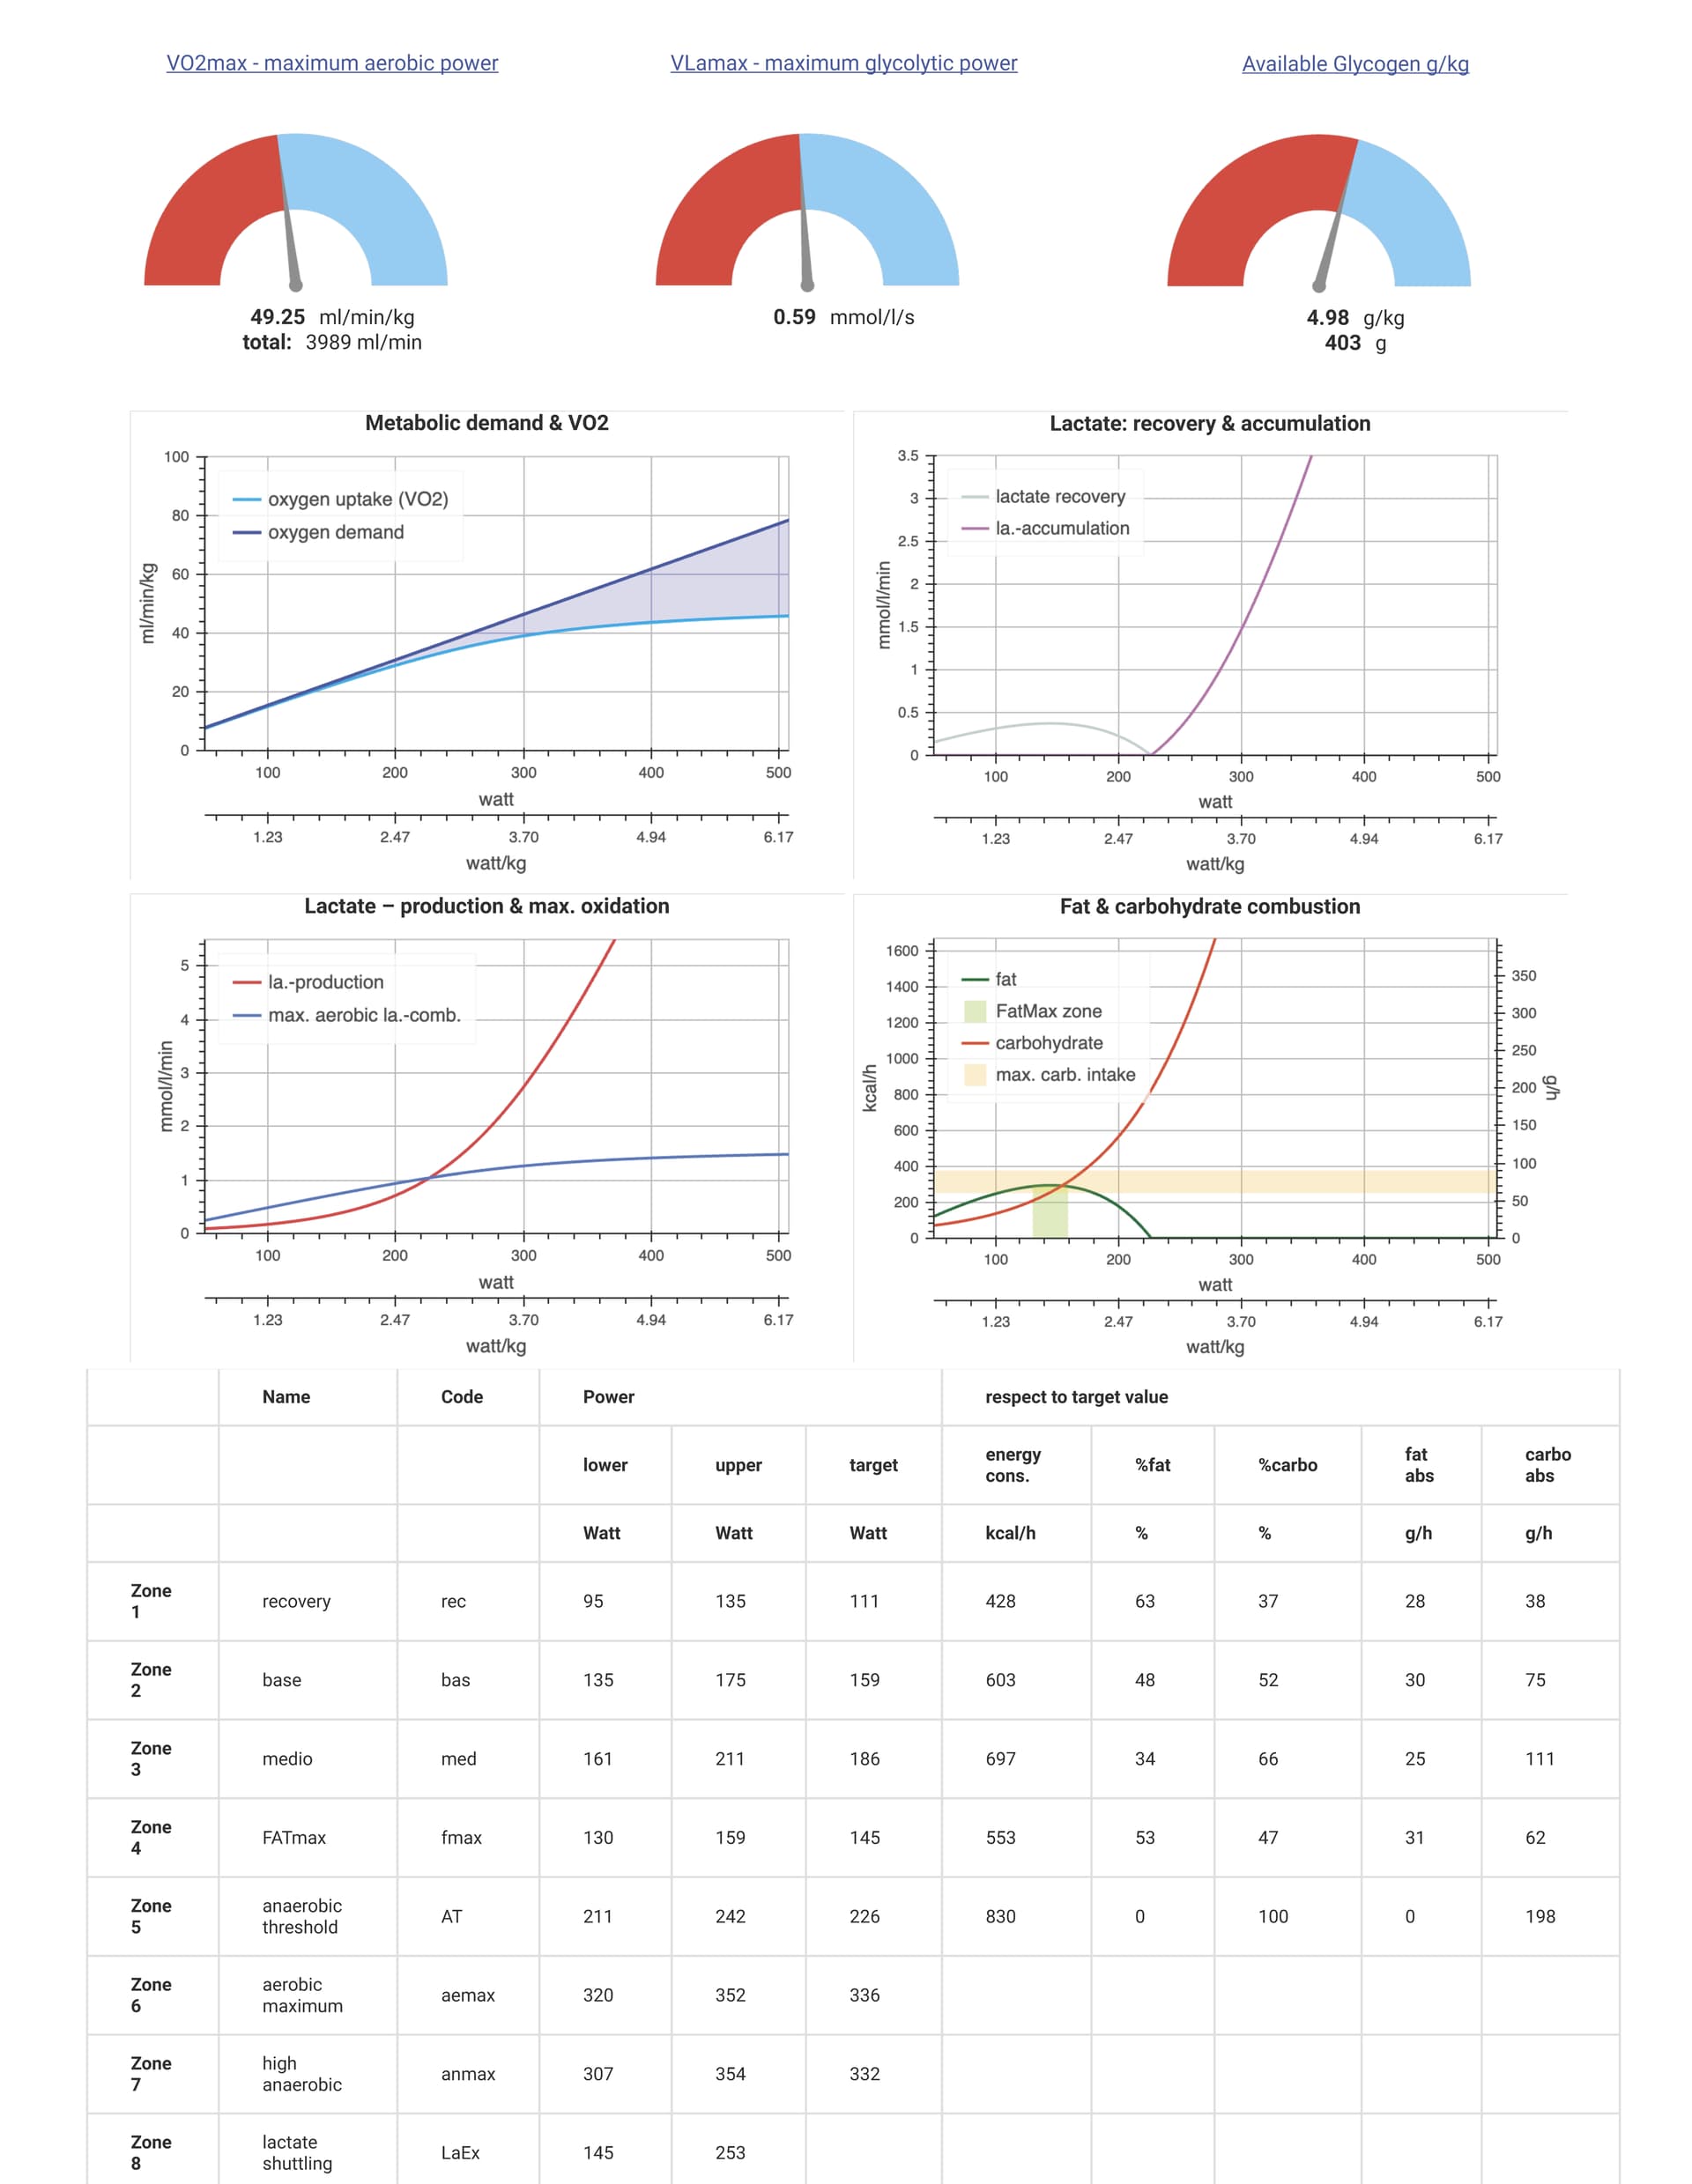
Option 3: Create your metabolic profile based on your power curve. This will provide you with VO2max, FatMax, CarbMax, VLamax, precise training zones (power and HR), ventilatory thresholds, energy expenditures (fat and carbohydrate burning), glycogen reserves, and the ability to calculate your intervals. You do not need to go to the lab, you only need to send your FIT files with maximum efforts. I can do this for you.
Thanks!
I performed an FTP test earlier this week using the Zwift ramp test workout so i have the power and HR data in a fit file.
I really appreciate the help and i’d love to send you the fit file for the ramp test i did if that’s what is needed to establish the metabolic profile you mention. That sounds like exactly what I’m looking for.
I have a couple months of training data in ICU as well if other info is relevant.
please let me know
The ramp test from Zwift is only really good for a VO2max estimate and the threshold estimate will be VERY fuzzy (and perhaps wrong). I’m not sure the exact protocol that Zwift uses, i.e. who’s protocol starts at 100w and increases 20w/min.
I currently have 8 models for VO2max estimates (ramp tests, 4m max power, 5m max power), 8 critical power models (2p, 3p, ODPM, ExtendedCP, etc), 2 power law models, and Mader’s model (VLaMax, substrate utilization). I’m still collecting models 
If you can share your mean-maximal power curve for the past 90 days, then we can make some estimates on your metabolic profile. I’d be curious to see how my estimates compare to Turbosnail’s.
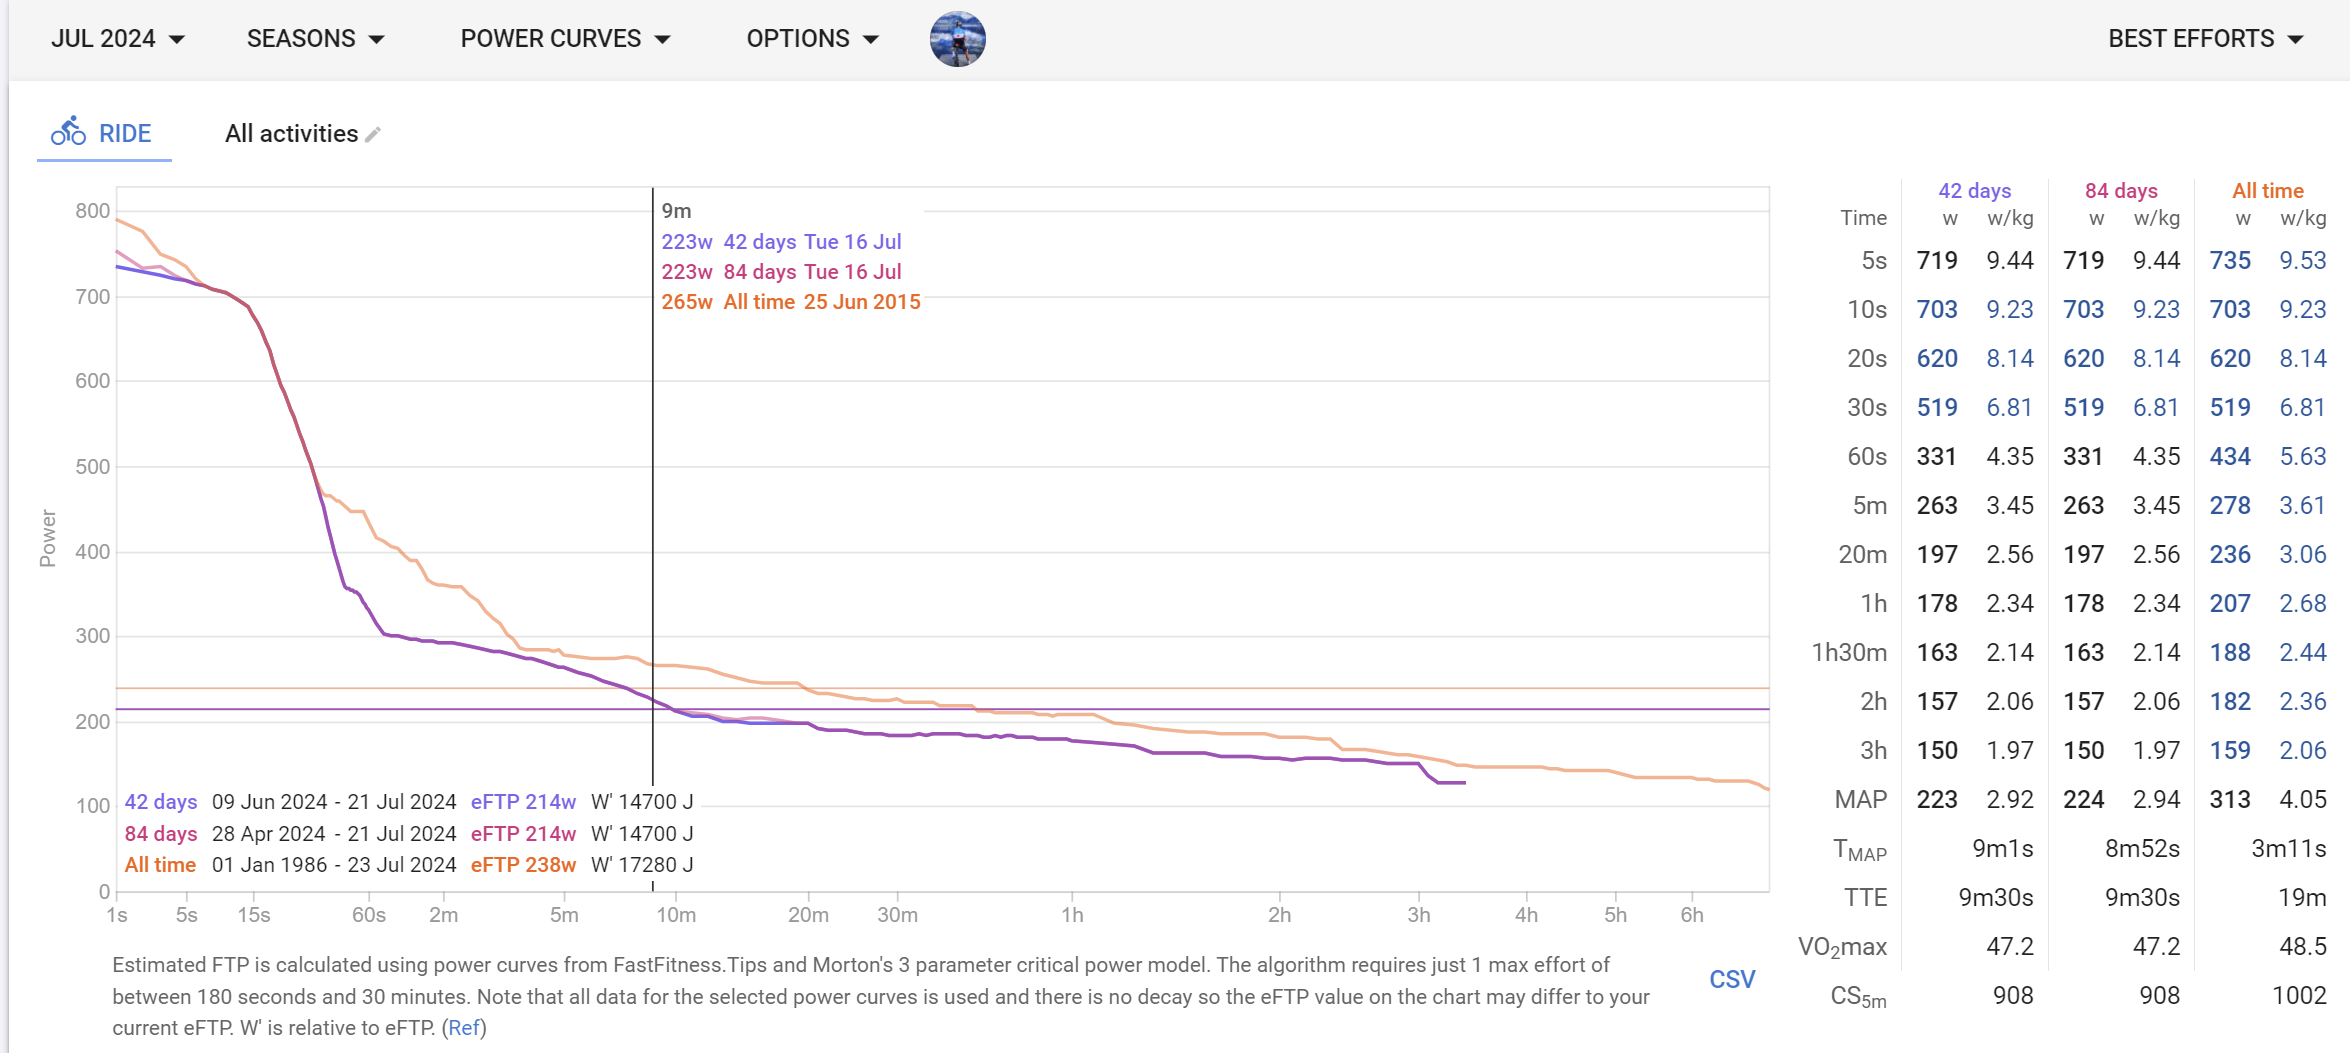
The all time data is from a period over 10yrs ago so not really applicable to current capability. At that time though i was more aware of maximal effort numbers for 5s, 30s, 1m, 2m, 5m, 20m, 60m so the numbers you see there are the best i was able to generate… although they do seem a bit low since i distinctly recall trying to get my 5s over 1000w and never beating the PB of 920. i was also probably 4kg lighter back then…
I n the last 90 days I haven’t spent any time outside of Zwift ramp tests trying to generate maximal efforts across any specific time period so all of these numbers are derived from indoor Z2 and V02Max structured workouts or unstructured solo outdoor rides ranging from 30miles (~90min) to 50 miles. (~2.5hrs). I think of these more as tempo? or at least Z3+ efforts. If I’m going out for 50miles i will sometimes try to measure the effort to try to go pretty hard across the whole ride, otherwise i might push on certain segments and relax in other areas while aiming for a HR that averages in Z3 without worrying if i get into Z5 here and there.
here is the raw data in a goglesheet.
Thanks for sharing your data!
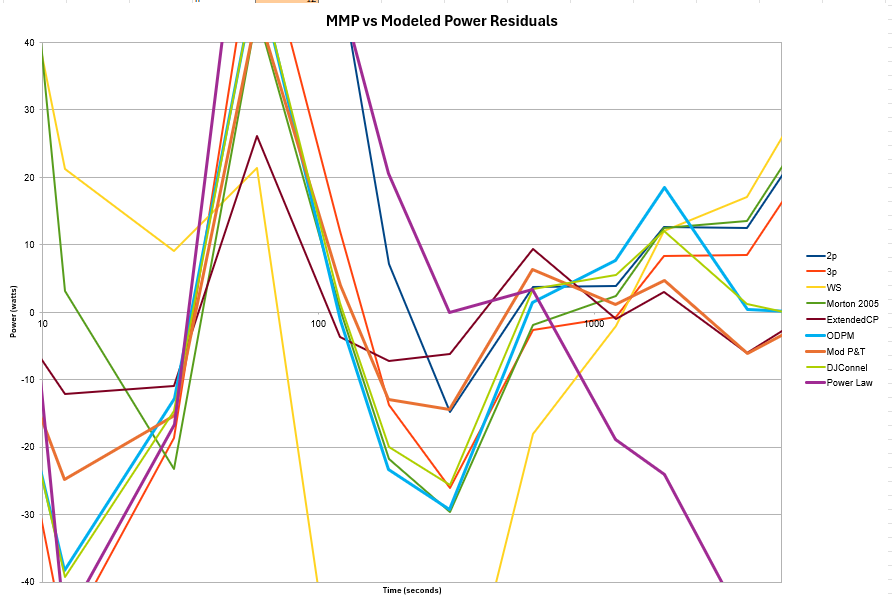
Unfortunately, your data needs a few max efforts in order to better fit the models. If you were inclined to do some testing…1m, 5m, and 25-30m efforts would help fill out your mean-maximal power curve and would tighten up the model estimates. Notice the residuals are quite high between you MMP and modeled power.
Testing isn’t fun, I know. But it’s really needed to perform decent modeling. Once the model estimates are better, then you can start estimating/predicting other things.
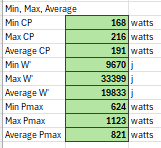
Summary:
Residuals:
I was going to do a Vo2Max workout tomorrow so I’ll restructure it around trying to establish 1m max efforts.
Not quite sure how to do this so i will probably do some 1 min intervals with 4-5min rest in between. I’ll start at 200%FTP and increment 5% each time until I can’t keep up with it.
Will that give a good read?
if that’s a reasonable approach I’ll do something similar for 5min on Thursday
In my experience, it’s best to do a single, maximum effort when testing at any given duration. You don’t even need to pace it that well, just go all-out. I need close to 10 minutes to recover from a 1m all-out effort, for example. The 5m max effort is painful for me…during and after. Actually, 3m all-out (starting with a sprint and holding on till the end) is my least favorite test to perform since I’m already starting to hyperventilate after 30-40 seconds and still have 2+ minutes to go.
If you are considering trying to increment to a max effort in a single workout, you won’t be able to perform to your limit and your 1m power will be underestimated. Based on your data, your current 1m power is ~331watts and 5m is ~263 watts. Those would be your minimum targets for testing…if your curve was well-defined. I would guess your 1m max is closer to 380-400w and 5m is around 275-290w.
Testing is like training…it just takes some practice.
Making mistakes is part of the learning process. Push the limits, to find the failure point.
In order to create a metabolic profile, it is necessary to conduct four tests to accurately determine your lactate curve based on your power output. The examination can be conducted outdoors on a bicycle equipped with a dependable power meter, or indoors on a stationary trainer, all by yourself. The accuracy of the findings is on par with that of a laboratory examination performed while wearing an oxygen mask.
Before performing a test or any other kind of exercise, please consult your physician and ensure that you are in good health.
What is needed:
- Maximal 20 second sprint (acceptable range 18s-24s; FIT file).
- Maximal 3 min effort (acceptable range 2:30 - 3:15; FIT file)
- Maximal 6 min effort (acceptable range 4:00 - 8:00; FIT file)
- Maximal 12 min effort (acceptable range 8:00 - 20:00; FIT file)
- Your age, height, weight, BMI index and body fat percentage (BMI and body fat can be obtained using a smart scale or estimated according to your body type)
All efforts must be done seated on the same bike, maintaining the same riding position (either on the hoods or in the drops), and preferably on the same terrain/gradient. It is recommended to spread them over three consecutive days, but not more.
During a maximal effort, it is required to maintain a steady power output from the beginning until exhaustion. For instance, in a 3-minute test, the rider may begin at 380W to end at 400W, but it is important not to start at 400W and finish at 320W.
What you get:
- Complete metabolic profile with explanation
- Precise training zones with energy expenditures for each zone
- Anaerobic threshold / Maximal lactate steady state
- Precise Functional reserve capacity
- VO2Max, FatMax, CarbMax, VLamax, FTP
- Glycogen storage capacity
- How your body produces and combust lactate
- How your body burn fat and carbohydrates
- Some training advice
- Answers to your questions
There is a small fee of 99 EUR because we need to cover the cost of using the software provided by a Swiss company that developed this technology.
If this is what you want, I can add you in my intervals.icu profile to provide further information.
Looks like the Inscyd test.
Can you do me? I am planning to do an exercise test, with o2 mask, in September. Curious to see how they compare.
power curve
That’s precisely what it appears to be…and based on Mader’s model. I can provide similar values (minus the fancy graphics) for free. I’m not able to do the full simulation yet, since the 2003 paper is quite challenging to understand for me.
1 Like
I would be careful calling things “precise” from this model. It’s a pretty good model, but even though you’ll get exact values, those values have a wide +- associated with the parameters.
I can take a look at your curve. Does your curve contain recent max efforts? In other words, does your curve accurately show what you are capable of right now?
Yes and no.
What are the relevant interval durations that are needed? I have not done very short (sub 1 minute max efforts recently).
Got the week of work next week and i plan to do a 20 minute test. I can add in some other durations if needed.
I typically do testing similar to how Tim from WKO recommends. Perform the max efforts within a week or so during training and then max out once a week at different durations to maintain the data.
We want to see a sprint effort (10-20 seconds) to get a better estimate of Pmax.
A 1 minute effort for short power.
An effort from 3-6 minutes for a VO2max estimate.
And a longer effort, like 20-40 minutes, to get a better threshold estimate.
I just ran your numbers quickly and noticed your residuals are highest at 30 seconds, 3 minutes, and 20 minutes. If you target those durations for testing, your model estimates will tighten.
Can you provide your current weight?
1 Like