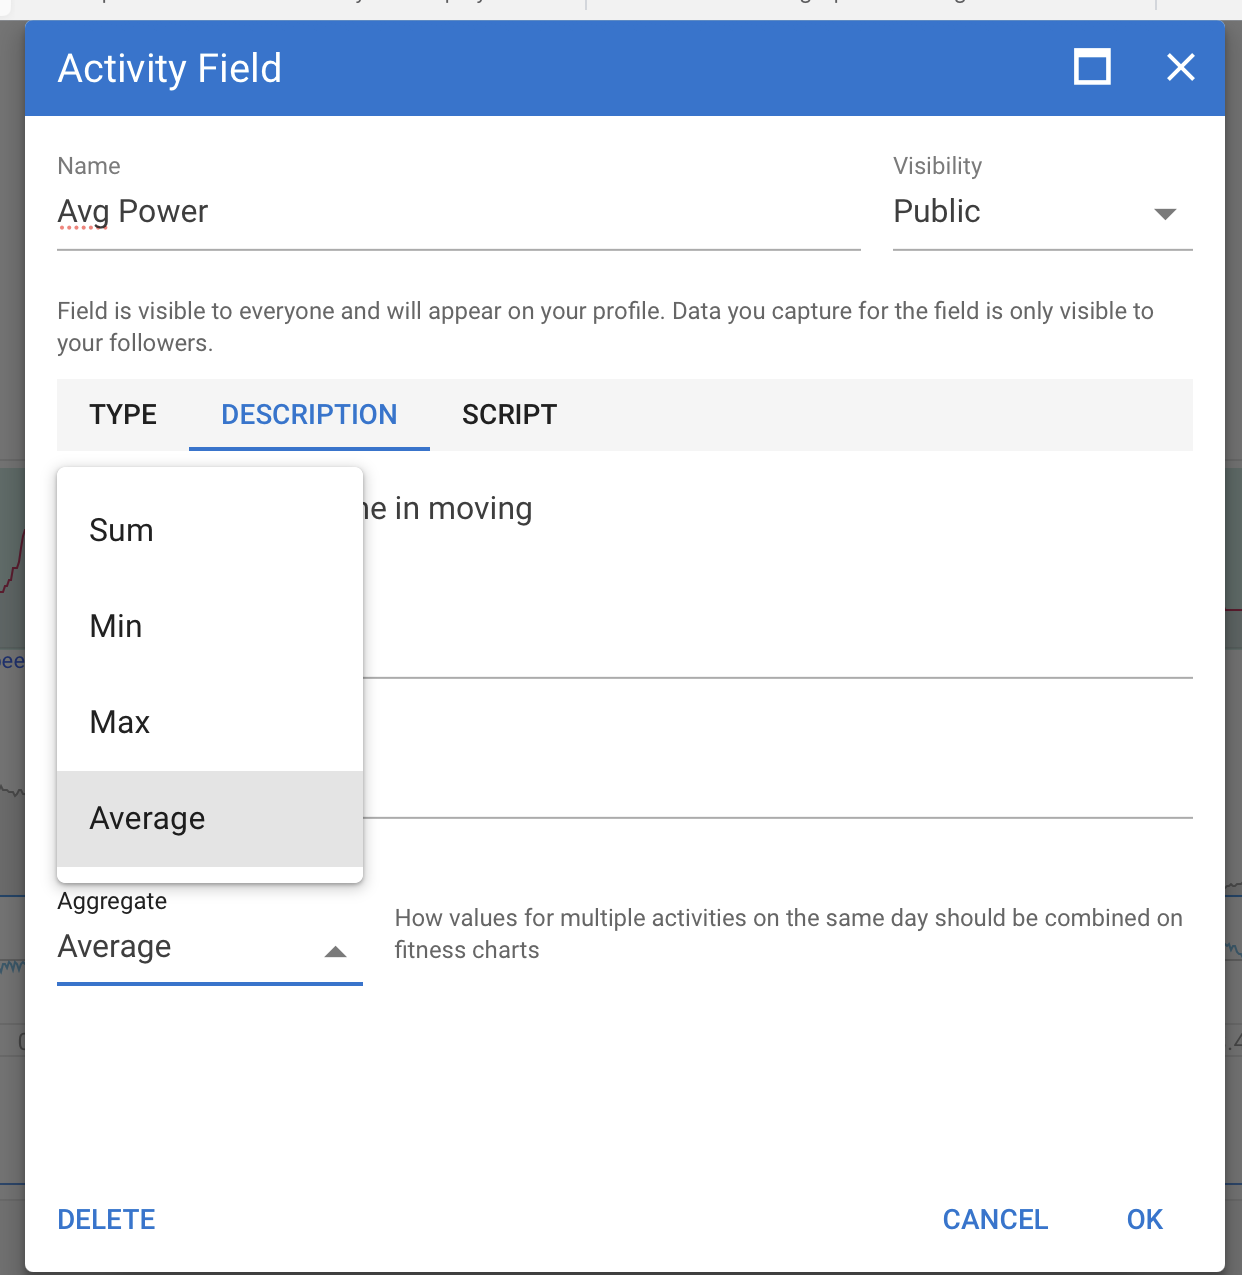
When i make a custom plot in the compare category and have multiple activities on the same day. There is only a single point being plotted in a scatterplot for that day even if there are multiple activities. I guess this is because the scatter plot only expects to plot one point for each day, rather than for each activity.
If I move one activity to a different day both activities are displayed. If I enable a filter in the custom plot i that removes the activity that is displayed, then the other is displayed instead. So clearly the scatterplot can only plot one point per day.
If there is an aggregate function somewhere that is choosing for instance to maximum of the two i could not find it.