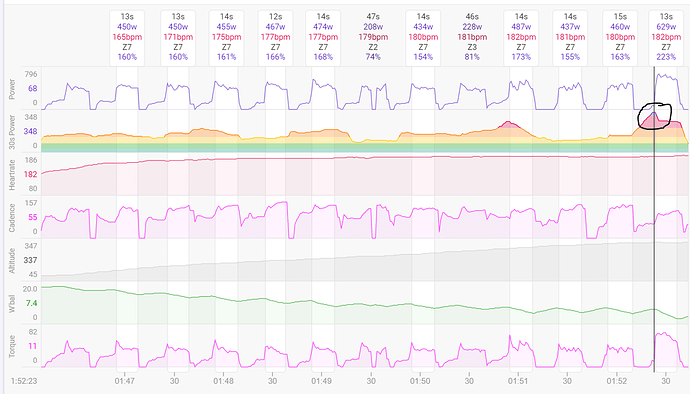
Is there a way to apply a moving average to a power vs time plot? Thought the 30sec average mentioned in the link could be an interesting way to look at unsteady hard efforts. Of course watching the W’ bal tank drain is another way to see this.
Not yet but that has been on the todo list for some time already. It will get done eventually!
The ride timeline chart now has a 30s power trace.
Very cool. Silly question…is the 30sec window for the following 30sec, not the preceding 30sec?
See the snapshot below of 15s-on / 15s-off repeats. I notice the peak 30sec comes at the beginning of my maximum 15s effort which is not what I would expect. (apologizes if I am overlooking something obvious!)
Snapshot from here:
https://intervals.icu/activities/3528493583?zoom=6282,6678
It’s a centred moving average so for time t it is the average of 15s before and 14s after. So if you do a 30s interval the peak of the average will be in the middle of the interval. This looks a bit weird for a 15s interval as the peak (correctly) is at the start and it flattens them out as you do the reps.
