Hi… My training load numbers on the LH side of the fitness page only go up to 60 and yesterday my load was 64 so the graph was just flattened off at the 60 mark. How do I increase the format to show a higher set of numbers over on the left or expand the page to show them? thanks
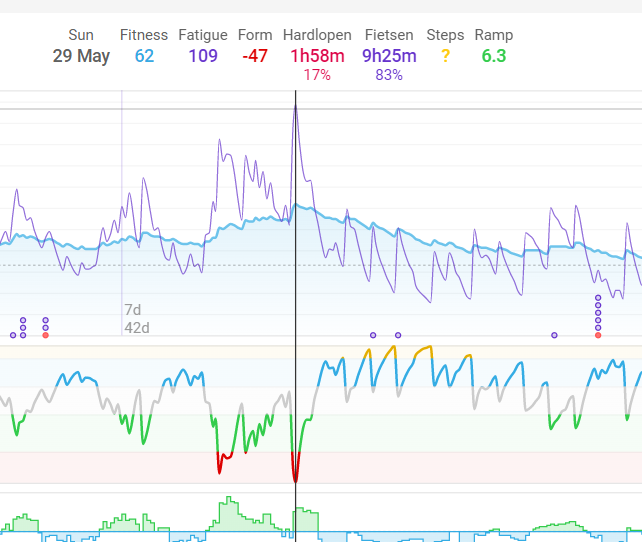
Are you sure you are not confusing “fitness” - your weighted average Chronic Training Load (CTL) over time shown on the fitness graph - and your daily training load?
Eg. My “fitness” is currently 101… but my training load from yesterdays workout was 150 - the two are not the same thing. The former is an exponentially weighted moving average (42 days) of the latter daily training load.
1 Like
No confusion. All I was asking was how to show fitness or fatigue levels on the fitness page higher than the current level which goes no higher than 60 if you look over on the left. Your chart may go up to over 100 but my limit on the chart, not my fitness levels, will not show anything above 60 but just flattens out as THE CHART does not go over than figure.
Please post a screenshot…
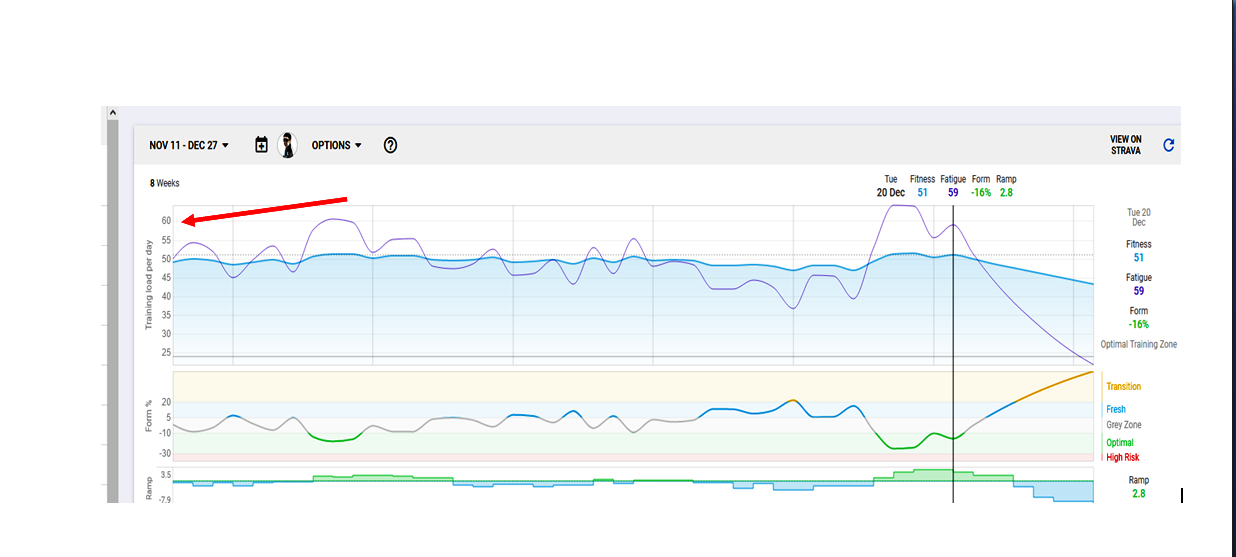
Here you are, I need to expand the chart to show a higher figure than 60 (arrowed) which is the upper limit of the chart at present. One workout took me above this and the fatigue level was just flattened off as it went to 64 but the chart could not display it properly, thanks
I’ve tried it on my data with 8 weeks time frame and it’s ok.
Might be depending on used browser.
Can you give details on OS, Browser etc to @david? He’s the only one who can help in this case.
Hi windows 10/11 firefox thanks