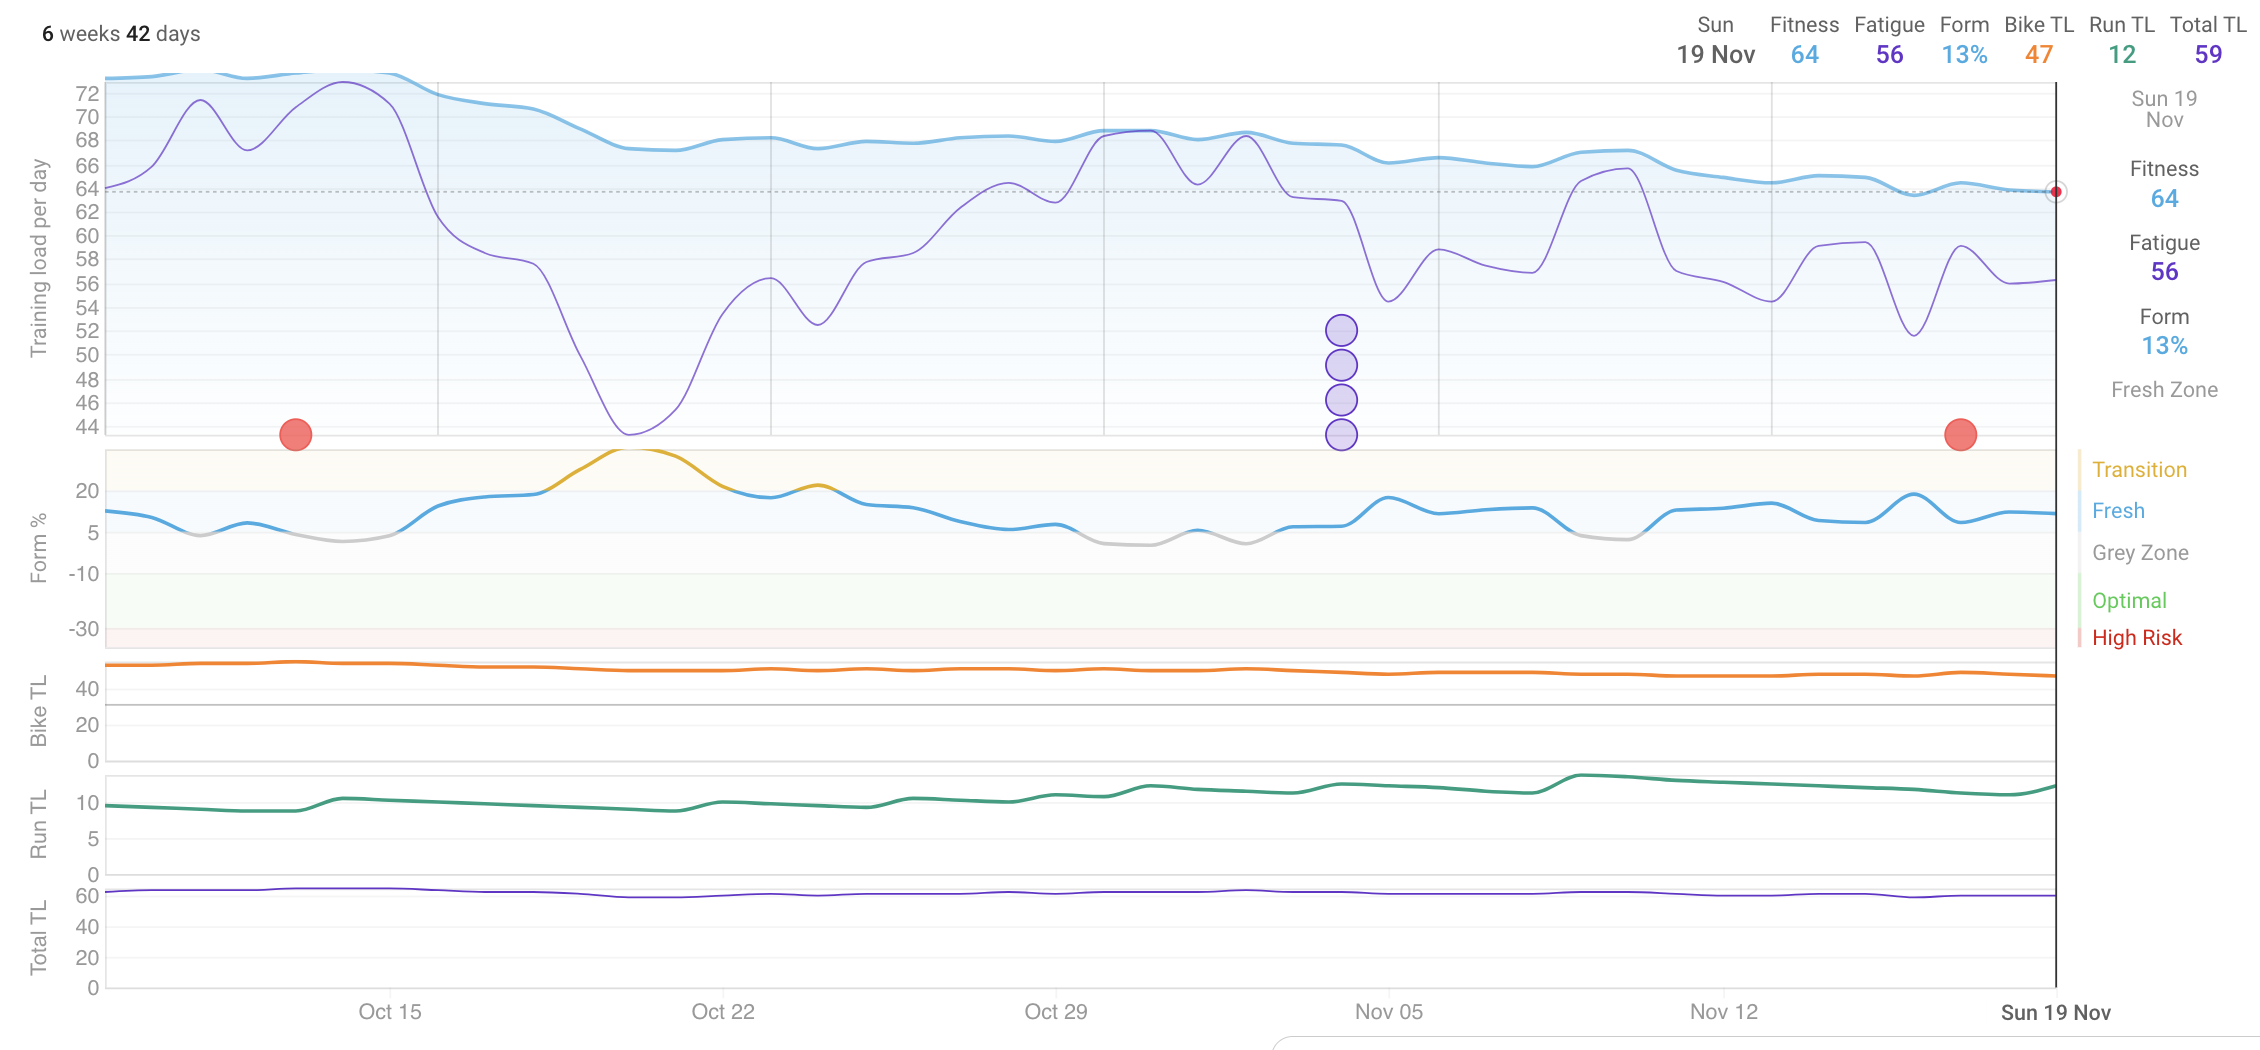
Either I’m doing something wrong or there’s a bug. I cycle and run, so I wanted to create separate CTL (“fitness”) values for each sport (bike is orange, run is green, total is purple). My understanding is that “fitness” is just a weighted 42d average of training load, but my numbers rarely add up. Looking at the 42d plot you can see that fitness (blue) doesn’t match the purple line, which is supposed to be 42d weighted training load (the same as fitness unless I’m misunderstanding).
42d view
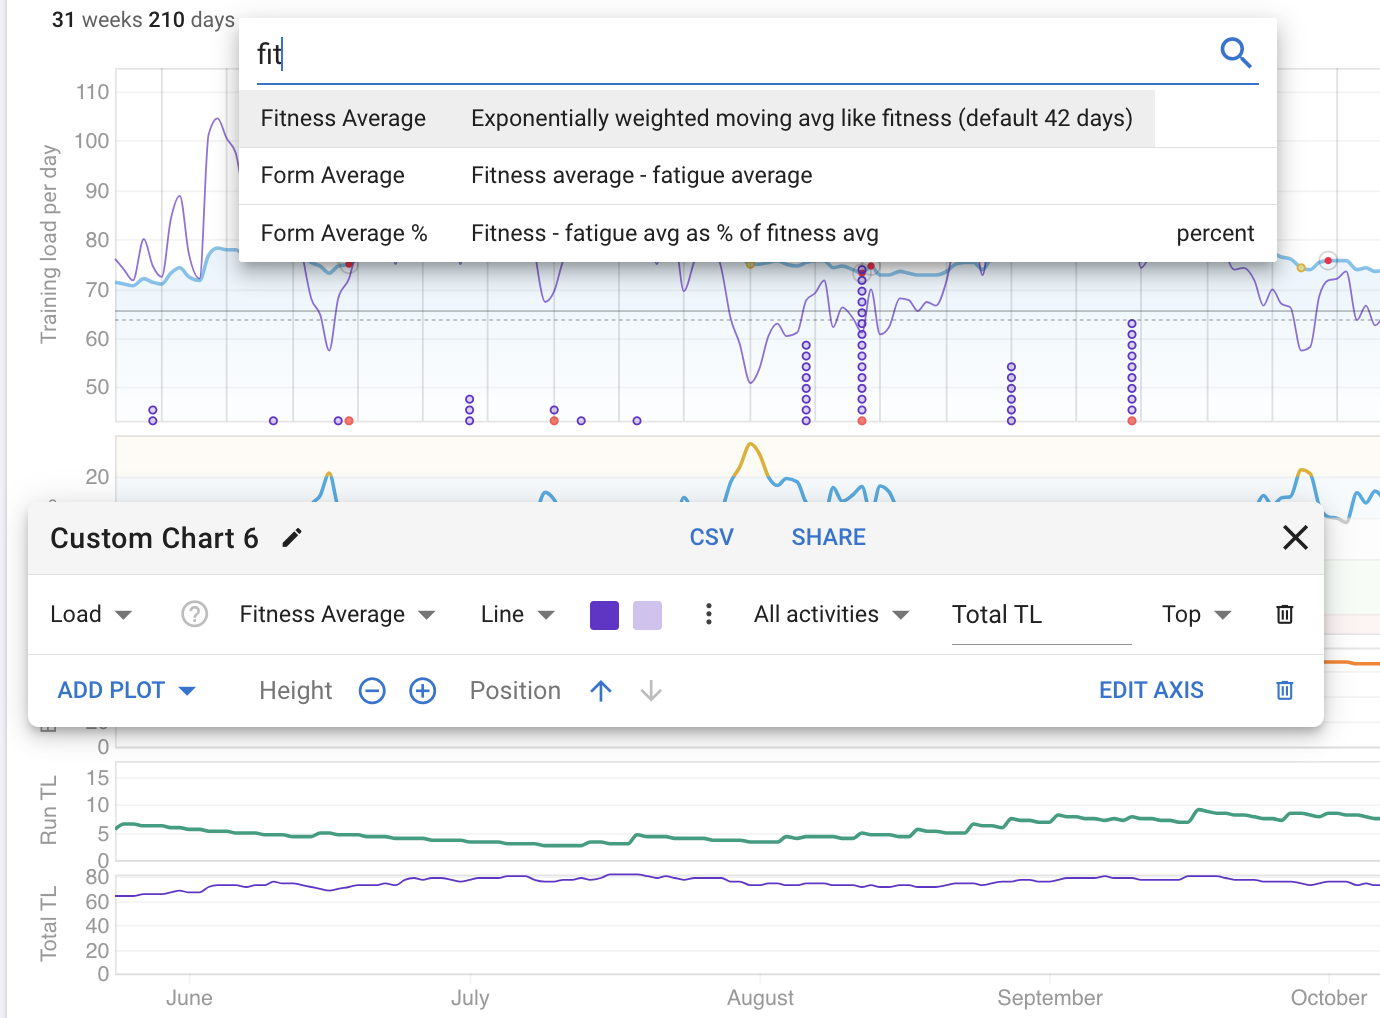
How I set up the TL graph
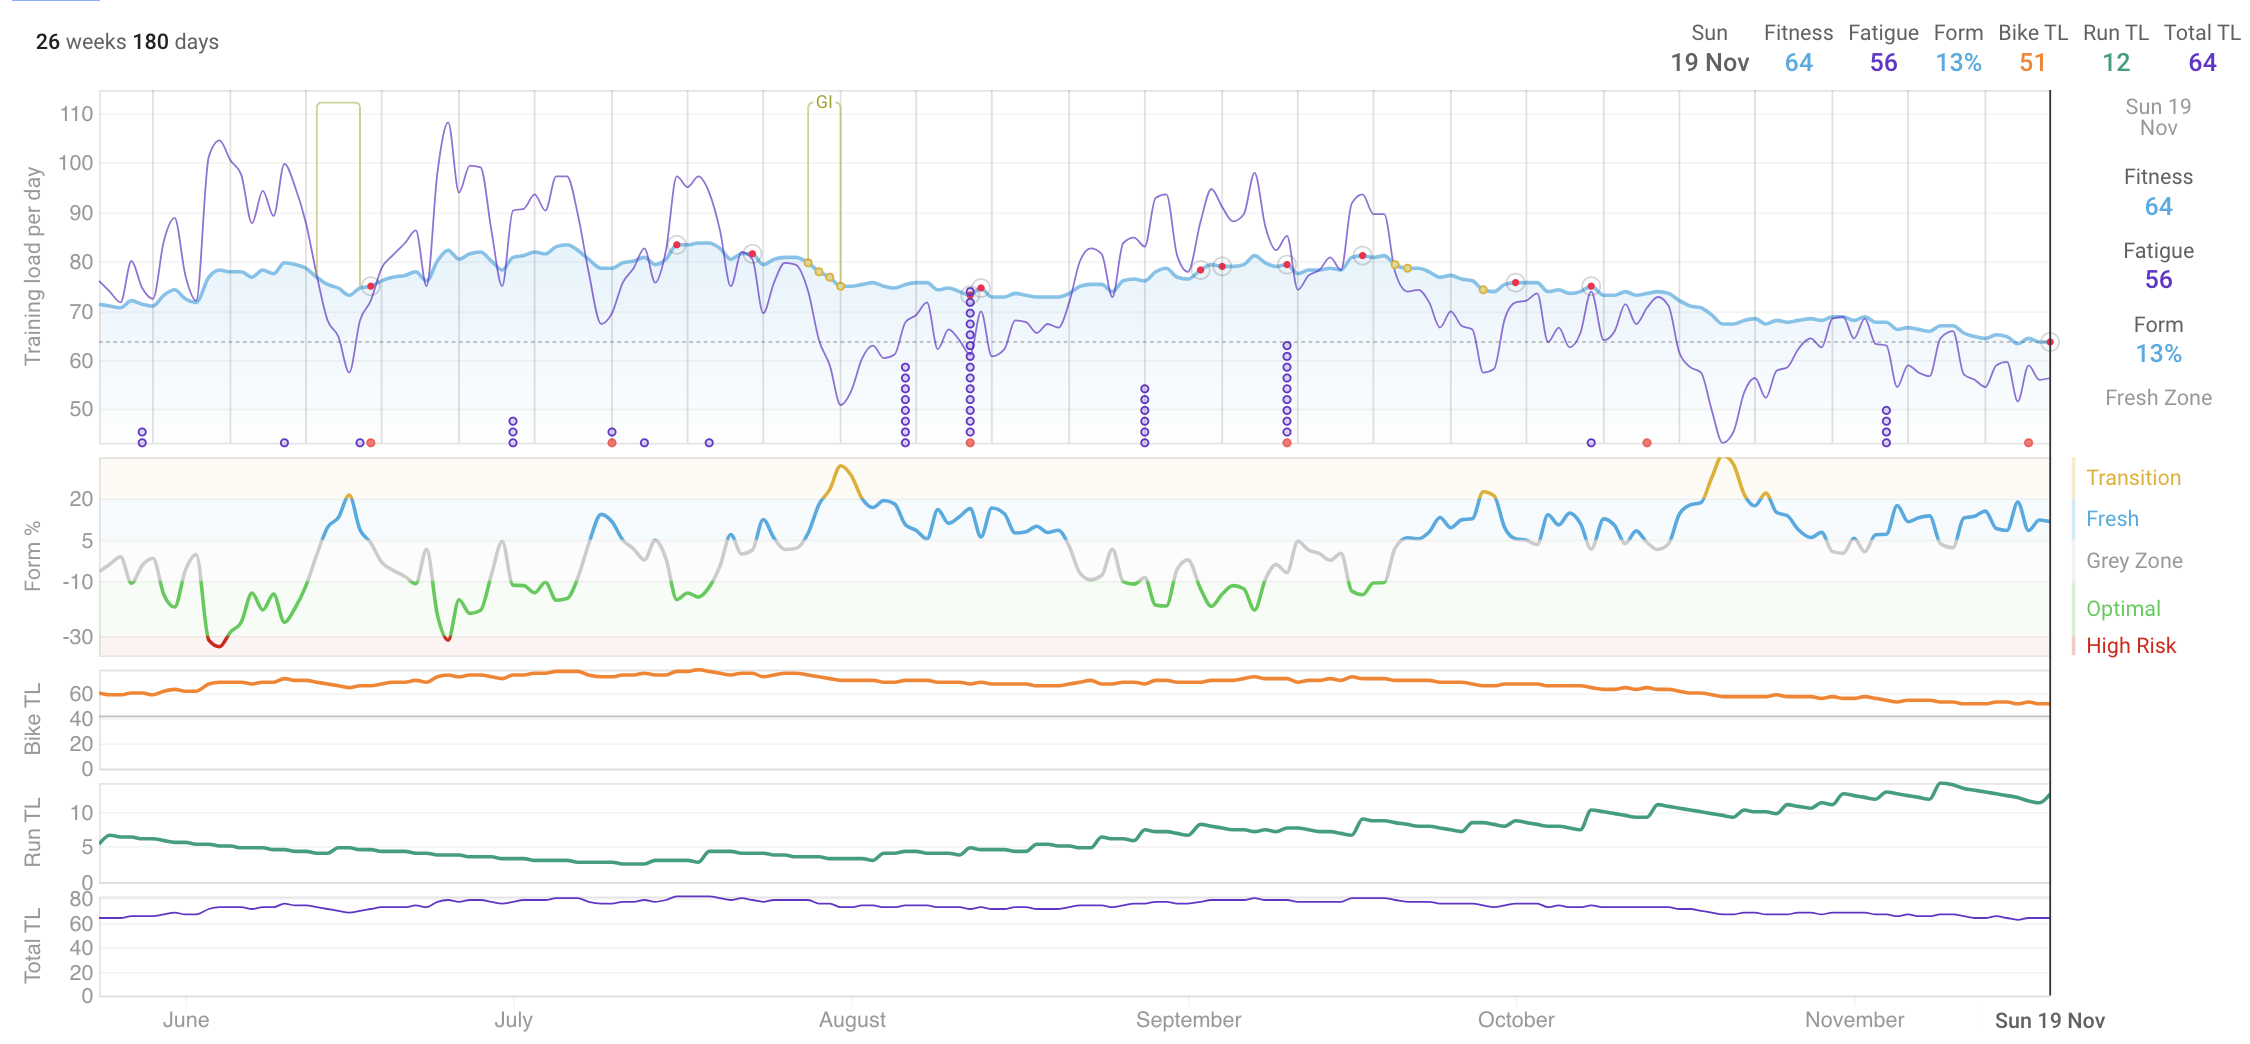
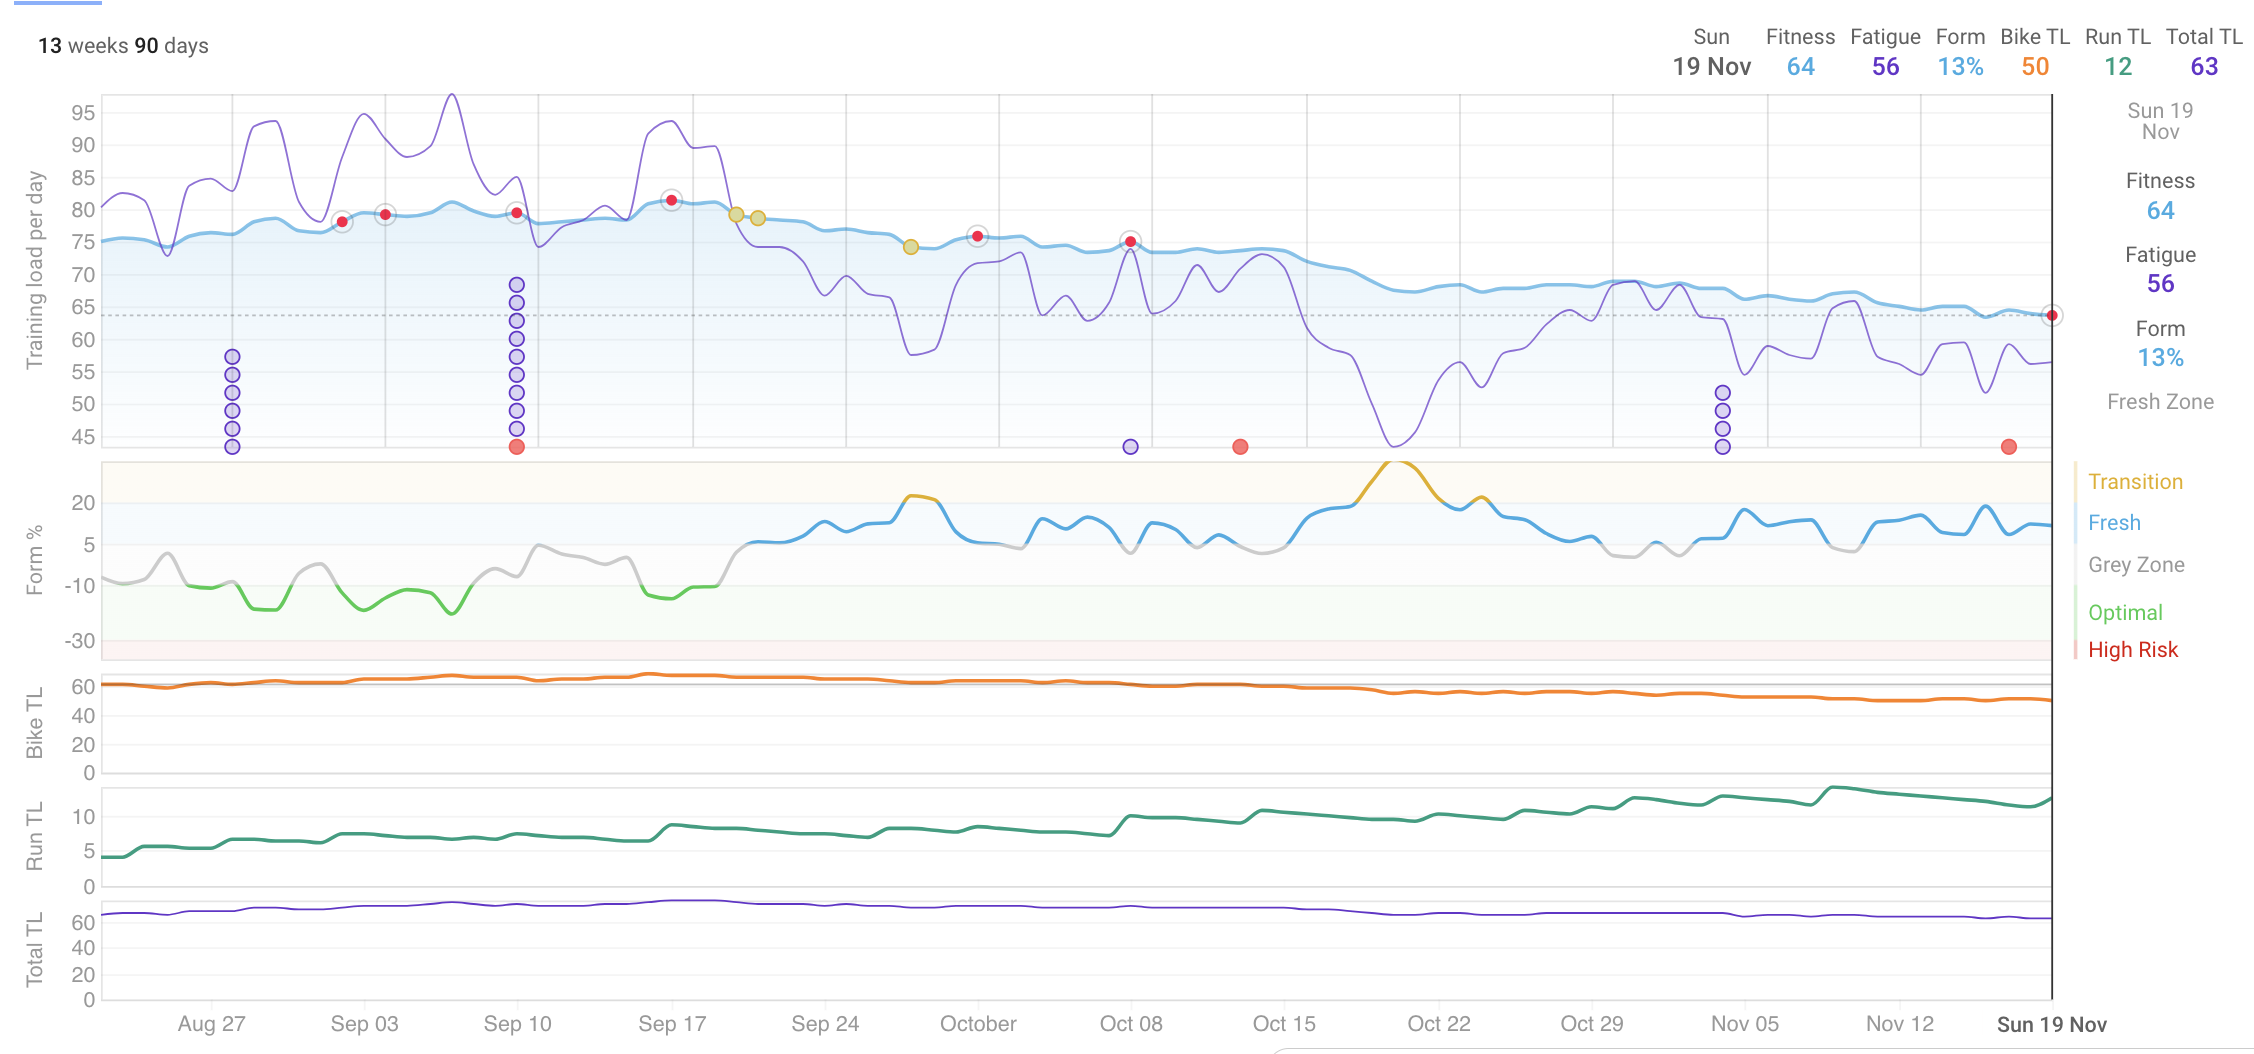
Another problem I’m seeing is that depending on which view I have (for example: 6 mos vs 3 mos vs 42d), the purple/orange training loads are being calculated differently and the value changes.
6mos
3mos
Have I done something wrong here or is this a bug?
Thanks!
Stephanie