In the last days I’ve been drinking before sleep and noticed that my resting heart rate is higher in the following day.
This is a known consequence of alcohol which it would be cool to monitor in intervals, it could even help in motivation to reduce drinking.
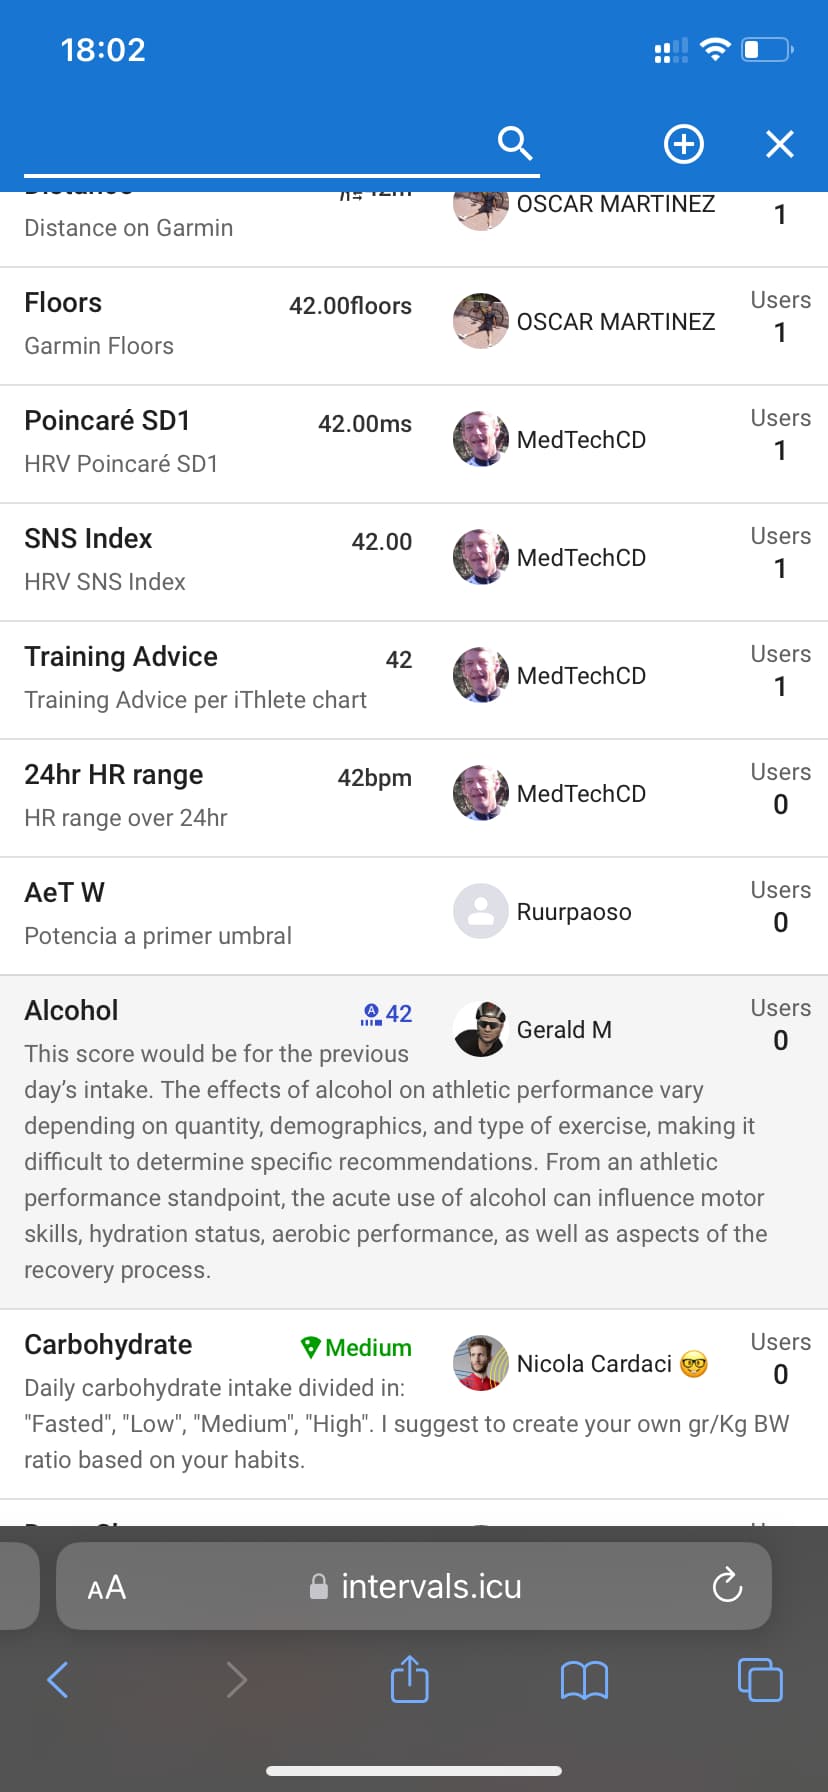
The HRV4Training app has the option to monitor alcohol intake and this data is part of the .csv which it exports to dropbox. Is it possible to import this data to intervals?
From health and your body perspective alcohol is a posion, what better motivation to at least reduce drinking do you need?
ps. higher resting hr is probably an effect of much weaker recovery during sleep after alcohol intake. It kind of makes your sleep data useless or you should divide sleep duration by 2 at least.
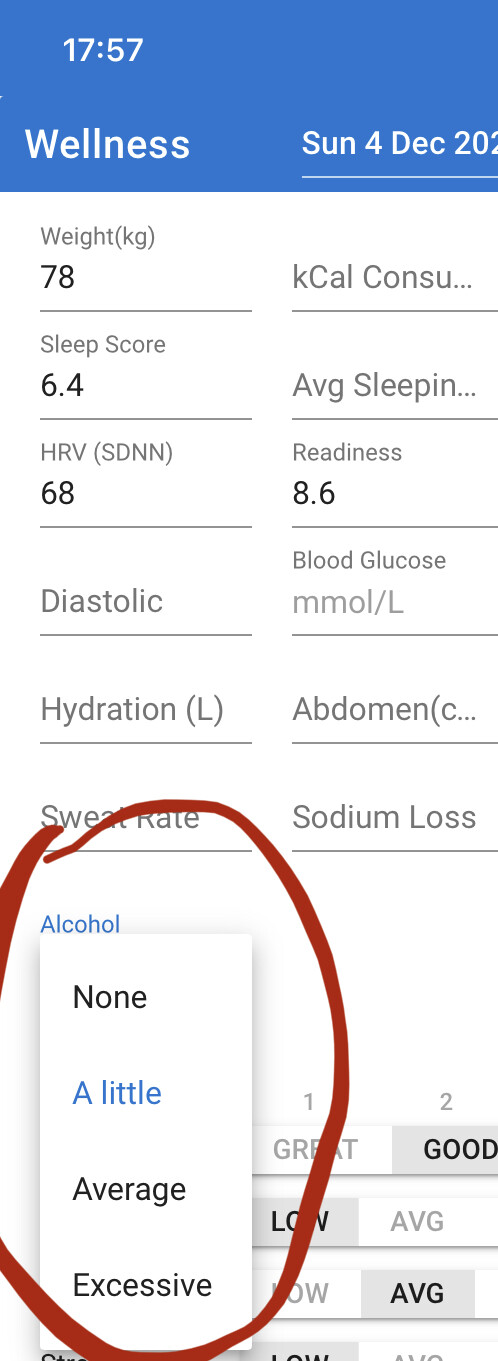
You can add the “Comments” field in the wellness fields to take a structured note of the units of alcohol. I know (by experience ) that alcohol intake shows in HRV.
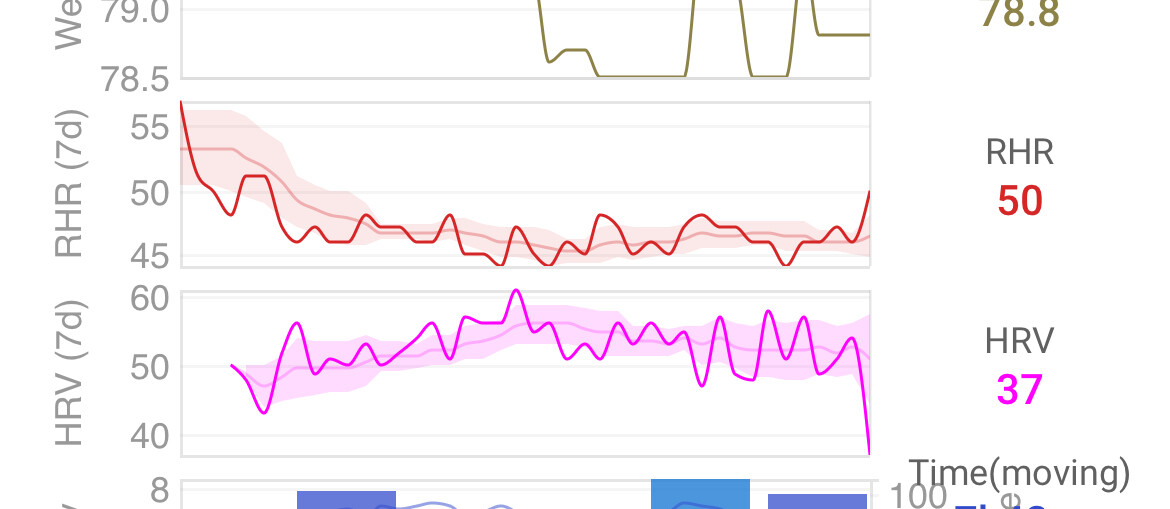
I (being a data nerd and IT guy) created custom wellness fields for both beer (in L) as well as caffeine (in mg) and have a small python script that lets me input what I drank in order to be converted into totals and pushed via the API - then I “adapted” the HRV chart to show beer/caffeine intake in combination with Resting HR
The idea of using the API is great (and obvious now that you said it).
When I have time I’ll work on a way to decode and import the alcohol intake data from HRV4Training to Intervals.icu
well it’s just basic prototyping for now as I’m working on a PWA (persistent web app) for morning reports where I want to integrate this. I’ll certainly share that once it’s done.
For now:
I basically store a structure of possible values (e.g. Red Bull - 32mg/100ml/250ml-can / Club Mate - 20mg/100ml/500ml-bottle, and so on)
then I built a ‘menu’ where I print all possible values and ask the user for input on what to do next (increase/decrease - and what item)
at the end of the script I just add the values (in mg) based on the respective ‘saturation’ and amount of drinks. → that mg number get’s pushed to the API via a PUT /wellness/YYYY-MM-DD with the apropriate field name and value
I display beer in liters (I don’t drink wine or any other alcohol) in correlation to resting heart rate
and just to have it look cool I added a 7d avg (Base) and 60d avg (Norm) with SD and CV%
Did a longish (for me at the moment) 4h ride in the morning, and in the evening had a fair few glasses of wine at a dinner.
I’ve got a very obvious downward spike in HRV (lowest since I started measuring couple months) and an upwards jump in resting HR. Also my sleep was pretty bad whereas usually I’m out cold after a long ride day.
Know this is an old topic, but having had practically zero alcohol for few months and very little in general nowadays it’s fascinating to see such obvious changes in the data.
I’ll be watching with interest to see if they stabilise and how I feel on the bike tomorrow……
 ) that alcohol intake shows in HRV.