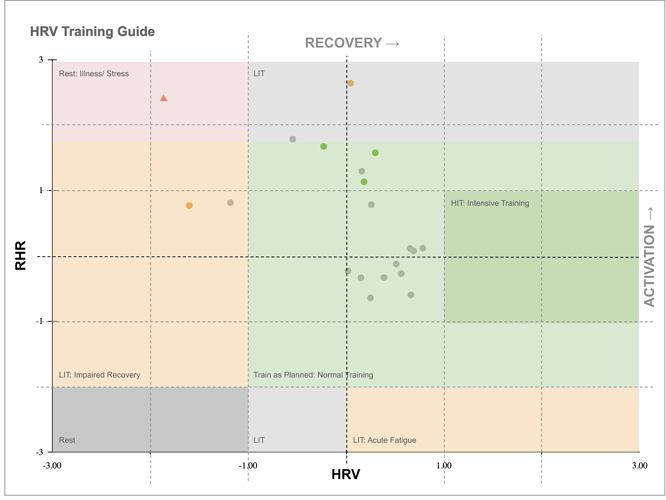
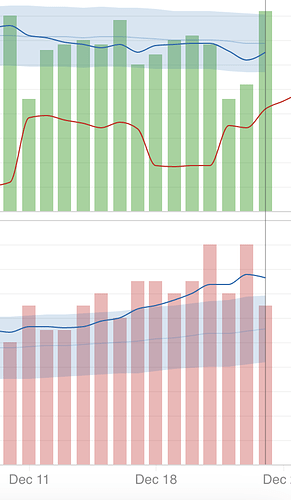
And I can confirm that writing the Training Advice field in Intervals works too.
I manually changed it to rest and after running the app, it was reset to todays HIT advice. 
The single quotes on the forum here are not the standard single quotes. Copy paste results in unrecognized characters. But you only have to do this once when another option comes to the configuration. Your configuration file remains the same, even if the main script changes.
I think you can get it right if you don’t use the preformatted text or blockquote in here.
Test copy paste this:
myTimeZone=’+01:00’
I think it’s not the same as:
myTimeZone='+01:00'
or
myTimeZone=’+01:00’
First one should work, the other two probably not.
Correction: the second one works. Use “preformatted text” to send the code and it should be easy to copy paste.
Normal text and blockquote give you the wrong quotes.
Do not worry about this. Single and double quotes are not exactly the same in Matlab, but in this context both are equivalent.
Use double quotes if it is more confortable.
Thanks @Inigo_Tolosa for this.
I have created a How to In the Guide section, so that the download, setup and user instructions don’t get lost in this thread. I will update it shortly, as I need to follow the initial instructions again to be able to make the changes.
Awesome!
Can also confirm that writing to Training Advice field works!
Thanks @Gerald for this guide, good idea to avoid splitting the info.
I think it would be good to keep complete up to date instructions in the first post of the guide. I will rewrite all and send it to you to update
The first post can be used to keep the latest version.
Once you make a change, I’ll copy the link and keep it current in the first post.
You will have to update it soon and with a very good surprise.
Intriguing 
On the Google Sheet, today I have no guidance - data is being pulled in.
I have been sick (which the system correctly identified), the numbers are now bouncing back.
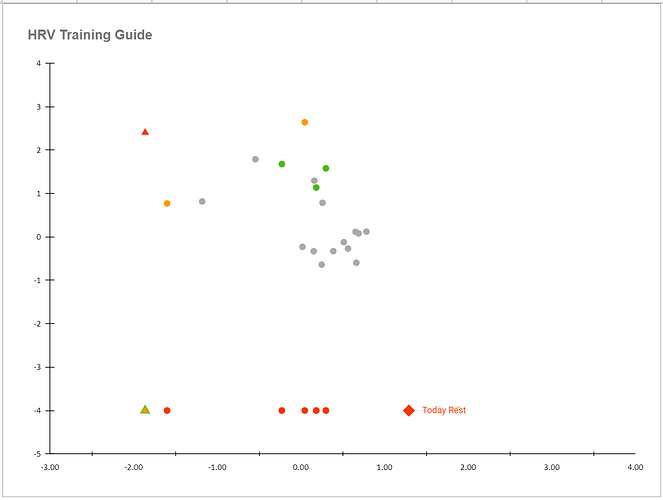
It appears in the sheet that there are some calcs of -4 which then don’t appear on the graph, is this a bug or just the numbers are too wacky to be worth plotting?
I went back through old dates on the excel tracker a few weeks ago. One day last year I was sick, with HRV so low and HR so high it couldn’t plot a point on the graph that day  I was so far off the top left of the graph it didn’t register a guidance point
There is a bug in the Google sheets version explained here
Use the brand new MatLab version, you will not be dissapointed.
If I adjust the graph axis, there is a plot point. I guess too far outside of the “norms” that it doesn’t make sense. If I look at the axis limits on the Matlab version it would also not plot a point here (assuming it has the same math?)
That is the bug in the Google sheets version I think. Once you refresh the sheet without data for that day, you get -4.
What are the Z-scores on the HRV tab for those days? If they are within +/-3, they should plot normally in the Excel and Matlab version.
OK thank, they’re ok
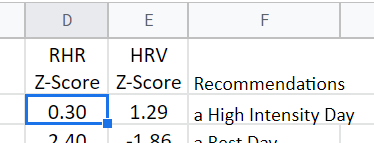
I only have excel on my work PC so the Google Sheets version suits for use everywhere, I guess unless it works ok in OneDrive / Office365
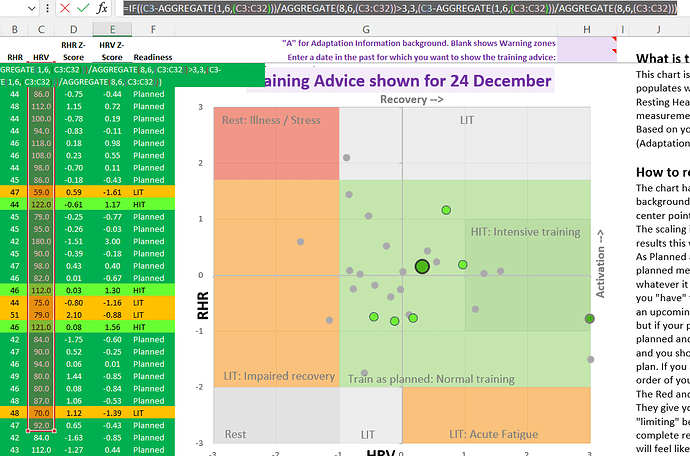
To eliminate the off chart numbers, the formula can be changed to include =if((formulae)>3,3,(formula))
This way, all off the chart data is limited to the highest value on the axis.
Image added.
To copy the formula, simply copy and paste the text below
=IF((C3-AGGREGATE(1,6,(C3:C32)))/AGGREGATE(8,6,(C3:C32))>3,3,(C3-AGGREGATE(1,6,(C3:C32)))/AGGREGATE(8,6,(C3:C32)))
Training Plan, HRV scores, Subjective feelings … Bringing it all together:
Very nice and easy to understand article on how to use your data in the correct way.
Looks very similar to what I wrote in the chart explanation in the Excel file. Not to say that I came to this conclusion myself, I rather made an overview at that time, from all I read and attempted to bring it all together in an easily to digest format
Can I ask a question about this graphic please, just to help me understand it better (or rather confirm my understanding of it)
- The increasing/decreasing arrows - Is this the 7d base v the normalised 60d band?
- What SD do we use to calculate the CV% normalised band and over what duration?
- Is there ever any value to comparing a daily value to a 7 day normalised band?
- Is subjective feeling feedback the most important ‘metric’ of all? - If you have experienced a little bump in HRV + SDNN (v 60d normalised) coupled with a little drop in rHR (but still well within 30 normalised), sustained over 4 or 5 days and you feel absolutely great and perceived exertion is down for a given effort, can you still assume everything is OK and continue as normal?
- The arrows indicate the direction of the 7d trend. The three uses of ‘above 60d’ or ‘below 60d’ indicate that 7d is above or below the 60d.
- 7d CV. No SD band.
- Daily HRV values, like daily rHR and RR, can indicate acute situations. So, yes.
- IMHO, yes. No instrument samples as often nor processes as quickly as the body. Learning how to listen very sensitively and understand one’s own patterns is hugely beneficial. However, it’s still posibble to be caught out. (I experienced parasympathetic hyperactivity last fall and it was the darndest thing. Everything said go, including my subjective feeling. What I missed was that everything was too good for too long.)
