HR @ Running Pace plot

A bit of a runner here. Currently, I’m tracking my HR at 6 min/km as a measure of aerobic efficiency. This is obviously very similar to what you’re computing for “Power @ HR”. But instead of a single value on the regression model (e.g. @ Z2 ceiling), it would be interesting to compare the fits for different time periods.

I know that power is easier than pace because of the hills, but we can use Normalized Graded Pace by TP or GAP by Strava (https://medium.com/strava-engineering/an-improved-gap-model-8b07ae8886c3).

3 Likes

You might be able to tell than I only do cycling (dodgy knee) :slight_smile: I have put this on the todo list.

Yeah, I noticed that running races do not show up on the PMC :smiley:

They should show up? Anything with HR should get training load.

They are not marked by red dots like cycling races :wink:

Hmm. Can you pls send me a link to one of them. Race or not should just pull through from Strava.

Here: https://intervals.icu/activities/2766708757

It hasn’t been marked as a race on import

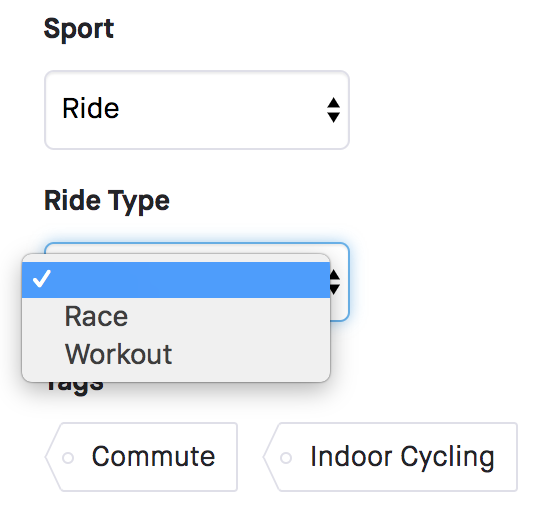
Nice race! Anyway the Strava “workout_type” is 1. For cycling a race is 11. If you edit that run what does Strava have in the equivalent “Ride Type” drop down?

Actually don’t worry, this field is undocumented but I managed to find a definition with Google:

pub enum WorkoutType {
    DefaultRun = 0,
    RaceRun = 1,
    LongRun = 2,
    WorkoutRun = 3,
    DefaultRide = 10,
    RaceRide = 11,
    WorkoutRide = 12,
}

Will be fixed soon.

Hi,

There is any update regarding this feature?

:slight_smile:

Want to bump this thread as well. The power page has the nice aerobic decoupling and power over heart rate graph.

For runners it would also be nice to have a GAP/heart rate graph, and I think that would also get us the aerobic decoupling (because i think we can use that ratio similar to power/hr ratio)

1 Like

Need to sanity check the current GAP implementation beforehand. First versions did not work so well, so I haven’t payed much attention to it. ;(