Dedicated thread for the new ImReady4 app, including how to setup, and use, this great added feature.
Latest update (v4.00 - 24/12/2022)
Dedicated thread for the new ImReady4 app, including how to setup, and use, this great added feature.
Latest update (v4.00 - 24/12/2022)
SETUP INSTRUCTIONS
Thanks to @Inigo_Tolosa for setting this up.
Based on the exceptional work started by @MedTechCD I (Inigo) have implemented a new tool with same functionalities as iThlete Excel/Google sheets, but mainly intended to be used in mobile phones (Android / iOS)
First, Inigo changed two things with the only purpose of avoiding any right conflict with the original company creating iThlete tool.
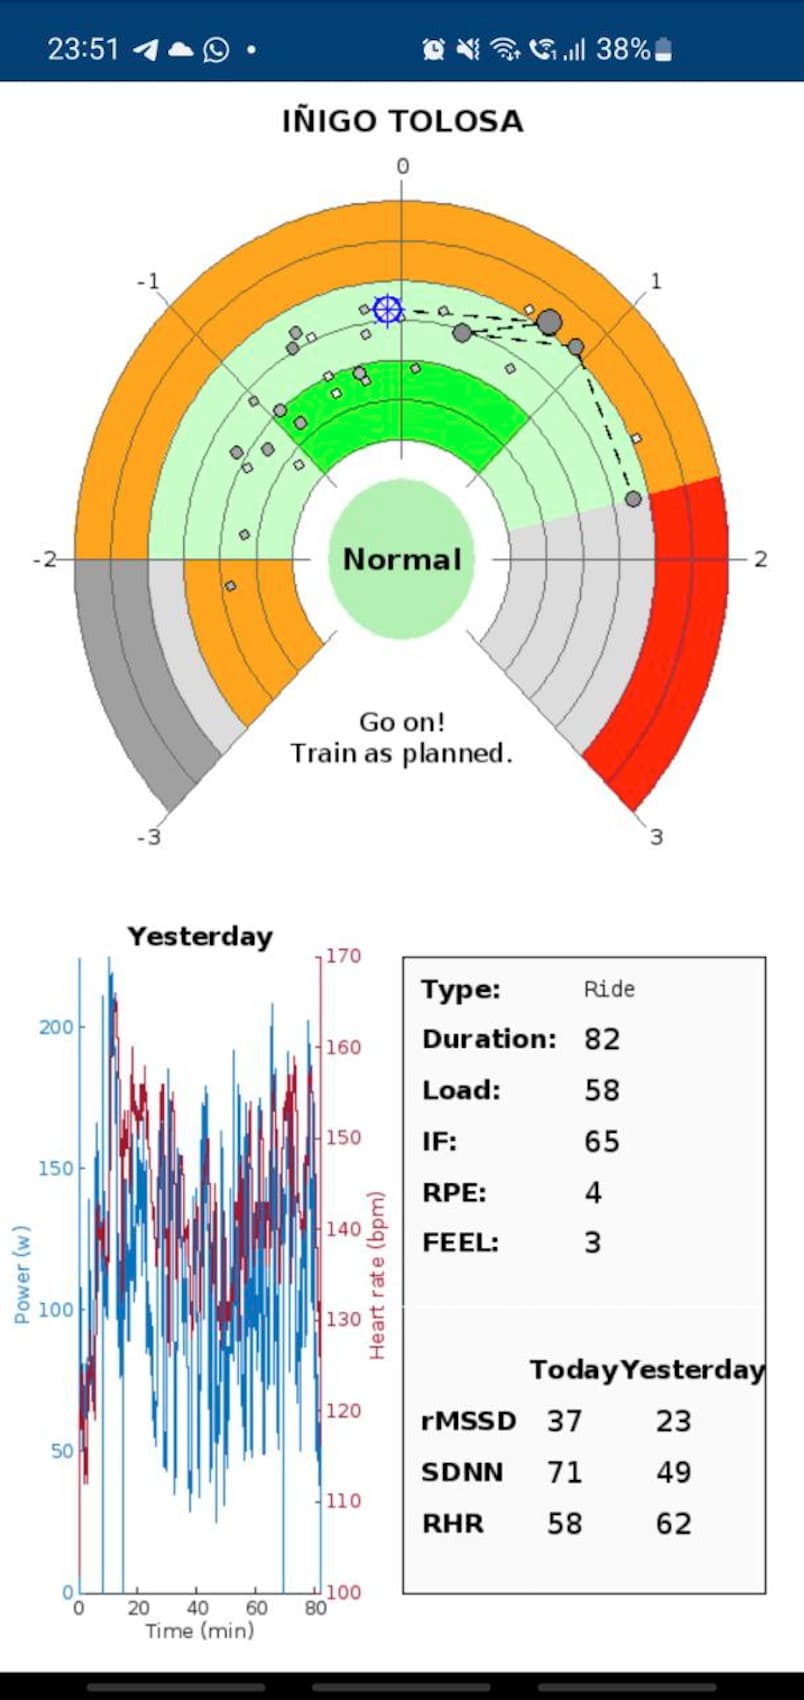
The screenshoot below shows the app output you should see when running this tool
It displays following 3 areas of information:
Purpose of these two last items is to help you interprete better the advice given by the tool.
Said that, the instructions to use this tool. It is basically a Matlab script that can be run into Matlab Mobile (free app, even if Matlab desktop version requires a paid license).
Matlab Mobile installation
Prepare your data file (required to allow accessing to intervals.icu and keep your data safe)
%%%% ATHLETES CONFIGURATION
%You can set as many athletes as you want
%Use  ONE line for each athlete. Remove lines that are not required
%   Name = whatever name you want to be displayed by the app for each athlete
%   ID = athlete's ID from intervals.icu account
%   APIKey = athlete's APIKey from intervals.icu account

athletes =   {
                 'Name_1', 'ID_1', 'APIKey_1';
                 'Name_2', 'ID_2', 'APIKey_2';
                 'Name_3', 'ID_3', 'APIKey_3'
              };

%%%% SETTINGS

myTimeZone = '+01:00'; %use following format to set your Time Zone info '+HH:MM' or '-HH:MM'

yesterdayActivity = 'HighestLoad'; %use one of the following options 'Last', 'Longest', 'HighestLoad'

trainingAdviceMustBeSentToIntervals = false; % set to true if you want to overwrite the "Training Advice" wellness custom field

%%%% NEW SETTINGS
daysForShortTermTrend = 7; %enter a positive integer representing num days
daysForLongTermTrend = 60; %enter a positive integer representing num days
multiplier_X_StdDev_ForLongTermTrendRange = 0.75; %enter a positive value representing num days

showValuesInTrendCharts = true; % set to true/false if you want/don't want values in trend charts
You can add up to 10 athletes if you want to follow several people (for instance for coaches) Results for all of them will be obtained and shown in a row.
Obtain access to the script
Following link will provide any of you with most up to date version of the script.
ImReady4
Click it to open a web browser. Select the script and drop down the Add file menu. Then select Add to my files.
This action will automatically create a new folder inside your Matlab Drive called ImReady4 that contains the script ImReady4.m This script is a copy of the original one.
Using the Archive option in Matlab Mobile, open this script and use the RUN button to use it.
In case you experience any issue related to your local time zone, it is possible to set the correct one adding following statement in the config_athlete.m file
myTimeZone = ‘+01:00’; %use following format to set your Time Zone info ‘+HH:MM’ or ‘-HH:MM’
Hope it will be useful.
CUSTOMIZED SETTINGS
A new update (v3.00) for ImReady4 is available with significant changes. As usual, this update is available at
ImReady4
Use the Add to my files option.
Changelog:
If you want to use these new functionalities, the config_athletes.m file should look like this:
athletes = {
‘Name_1’, ‘ID_1’, ‘APIKey_1’;
‘Name_2’, ‘ID_2’, ‘APIKey_2’;
‘Name_3’, ‘ID_3’, ‘APIKey_3’
};myTimeZone = ‘+01:00’; %use following format to set your Time Zone info ‘+HH:MM’ or ‘-HH:MM’
yesterdayActivity = ‘Last’; %use one of the following options ‘Last’, ‘Longest’, ‘HighestLoad’
trainingAdviceMustBeSentToIntervals = false; % set to true if you want to overwrite the “Training Advice” wellness custom field
Hi @Gerald
Great tool, I tried to use the excel sheet but it involved more steps that I was able to do daily, having it on the phone is a game changer.
I think it is important for people that arrive here to add this link which describes how to use this plot How to use the ithlete Pro Training Guide
Just to confirm, in your conversion from cartesian to polar coordinates, you are using the RHR as radius and the HRV as angle? I tried to confirm it in the code but my matlab days are long gone 
Thanks for the great work
I would be careful with following 100% the ithlete guide, I think that in this case it would not be the right thing to do. I have been testing with Iñigo for a while and not everything he says is applicable as it needs a post analysis. The ImReady4 application gives more interpretation information as it is indicating the load, training time, IF, duration, sDNN, etc…, at first glance we already have more information, ithlete probably see your baseline of more days through the database that has the athlete. My advice is to apply ImReady4’s advice and do an analysis of the data the app is giving us.
From center to the outside (+3 to -3sd) is the HRV.
From left to right (clockwise) is the RHR (-3 to +3SD)
Basically, you look from the right side of the square chart in a panoramic view.
If that’s understandable 
That’s right.
I think that seeing both charts at once, it is quite easy to understand the transformation from cartesians to polar
This is awesome! Tx a stack for putting it together!
I am going to be adding support for scripts for custom wellness fields soon which might make it possible to do this sort of thing inside Intervals.icu … at least the calculations. Completely custom charts is another whole piece of work.
In the end, we finally overcame the monopoly of training peaks and wko.
and made it a lot better as well, the API alone is awesome, now with the javascript fields as well, thats already far ahead of training peaks and wko in my opition.
ImReady4 brings a Xmas gift today 
In version 4.00, two pages are displayed for each athlete
1 - the standard one available till now
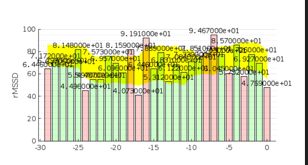
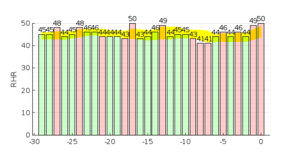
2 - trend charts for rMSSD, SDNN and RHR
Trend is plotted for the last 30 days. The expected normal values range is defined by (ma +/- sd), being
ma = moving average of last 7 days
sd = moving standard deviation of last 7 days
Values out of range should be plotted in faded red, values within the range in faded green
If you find any difficulty reading the value on top of each bar, try to zoom in and drag the chart
No need to modify the config_athletes.m file.
Enjoy.
Thanks again!! Savage.
Tried it there. No issues except like you mentioned that it might be difficult to read.
It’s very cluttered with the values shown on the graph. Zoom doesn’t work very well but I think if you omitted the values in the graph and just had the bars then it would be a much cleaner graphic.
You get away with the values in the rHR chart but not rMSSD or SDNN
I’m mobile now and can’t post a screenshot (never seem to be able to add a screenshot from a mobile to this forum)
A question re the graphing. Why a 7d SD?
Is not recommended we use 7 day average as a baseline and 60d +/- 0.75 SD for normalized?
RHR uses 30 +/- 1*SD for normalized?
Don’t worry about period for moving average and sd calculation
v4.00 is the framework for this upgrade. I will set these values later and will provide also ability to customize them by means of settings in config_athletes.m
Same for values on the charts, that you will be able to enable/disable
I have no more time right now, but I think it was worth posting the update like this.
Any additional feedback is welcome
Super stuff. It’s a fantastic tool to have and as always it’s much appreciated. Wishing you and yours a very happy Christmas 

Perhaps it could be interesting some kind of alert on the sDNN today value. I mean, you can get the “Go on! Train as planned” message, but you can have an unusual (too high or too low) sDNN value.
In 60d the data may be biased for several reasons. It is important that you have your own protocol, not what others tell you on the internet. You will be able to adjust better with fewer days. As for deviations each athlete has a data, hrv values can not be seen as something standard and if something personal for each one, it is important to understand this, there are athletes who are able to lower the hrv and work well and others who can not lower it much, my advice is that you adapt everything to each of your athletes, customizing everything.
Look how well the trends look at 30d, rmssd increases within its baseline, sdnn also and heartrate is decreasing and creating the trend on those specified days, this is good groundwork and an excellent fit.
How do you get the values on the chart to look like that?
This is what mine look like. Very cluttered.
But my rHR is fine
I already have them like that.
Did you copy the latest script folder?