When Strava changed the API I checked the box to Garmin to download activities instead Strava but marked on it as well.
My believe was that Intervals would prioritize the one from where it was originally recorded and I don’t record anything on Strava. It’s only a backup for a possible gps device failure.
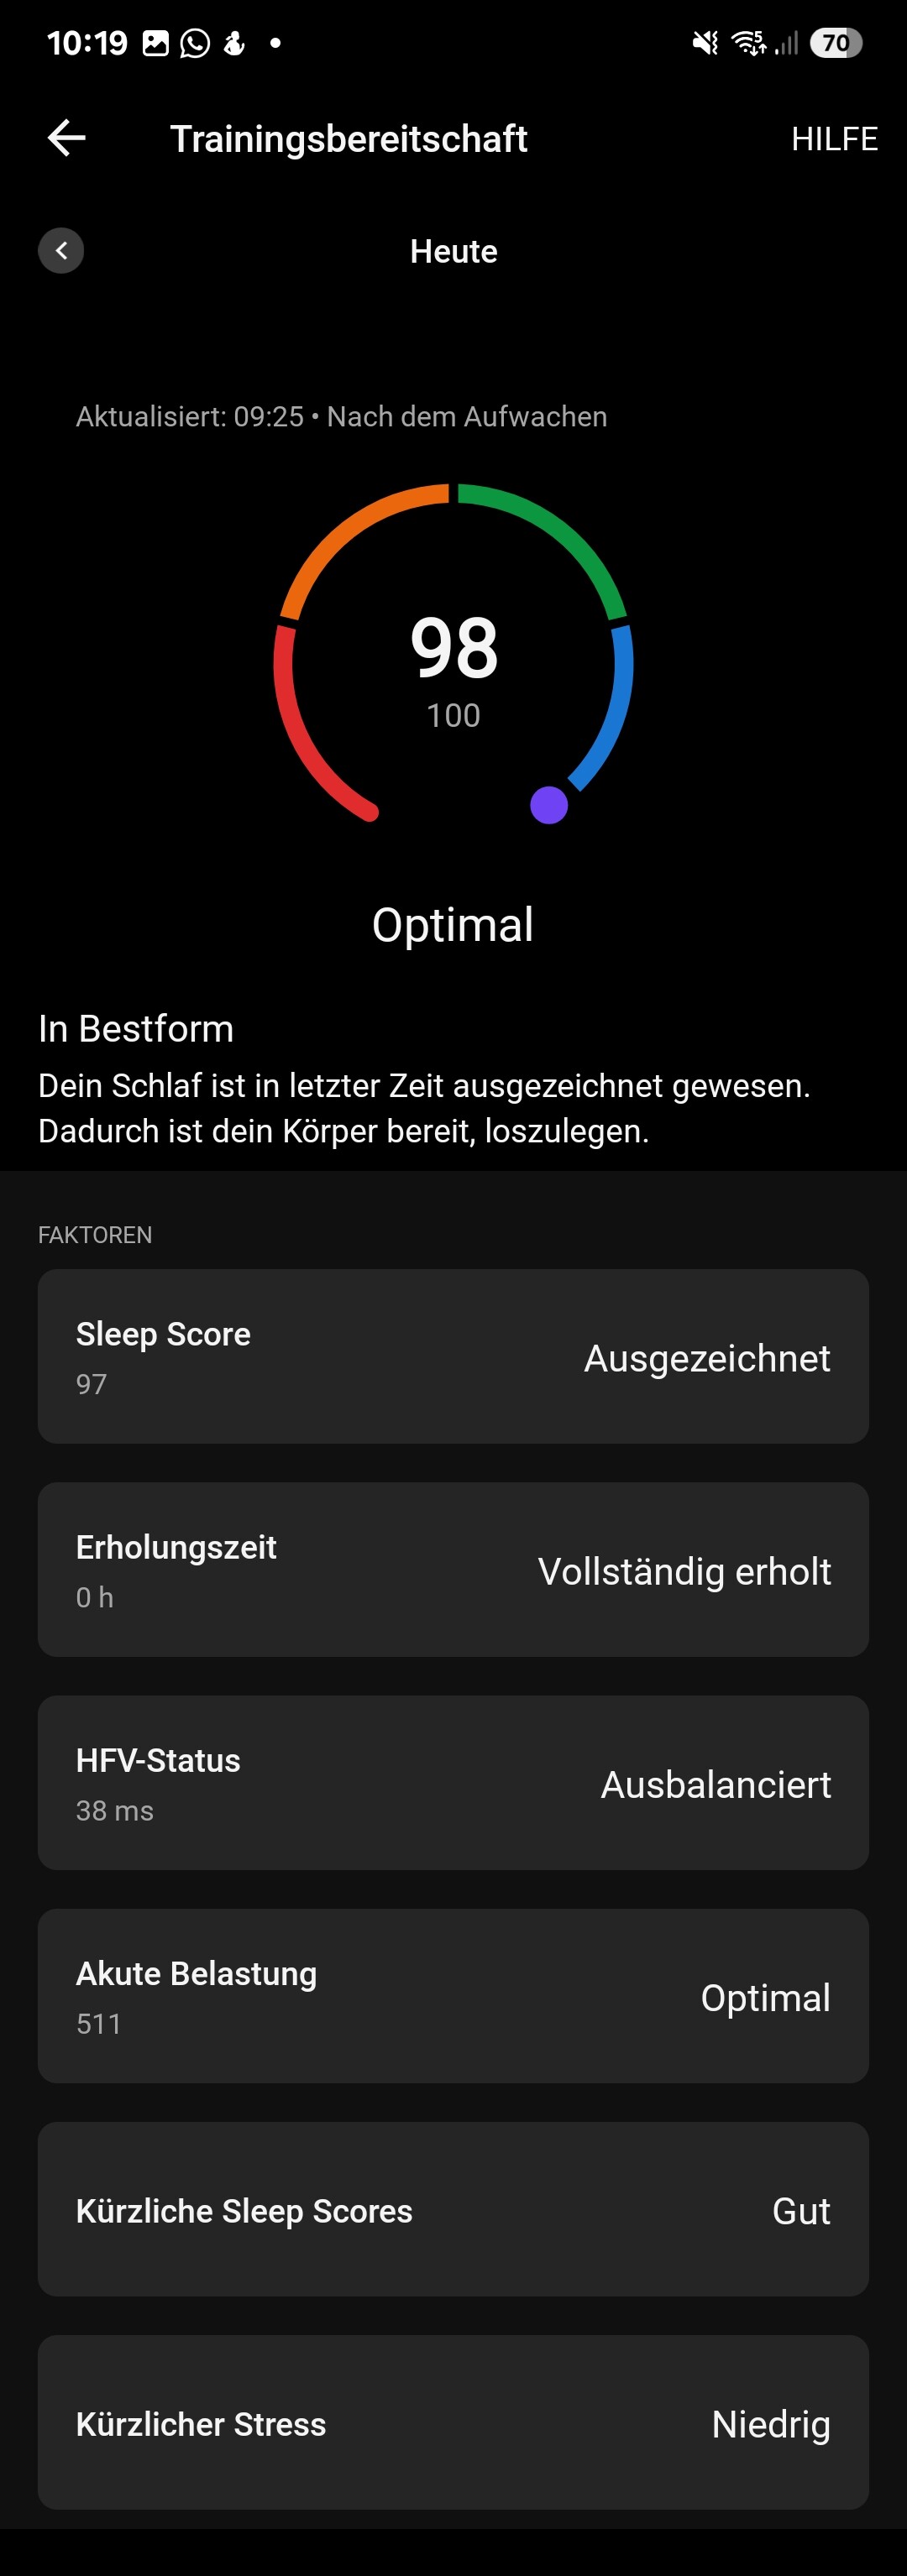
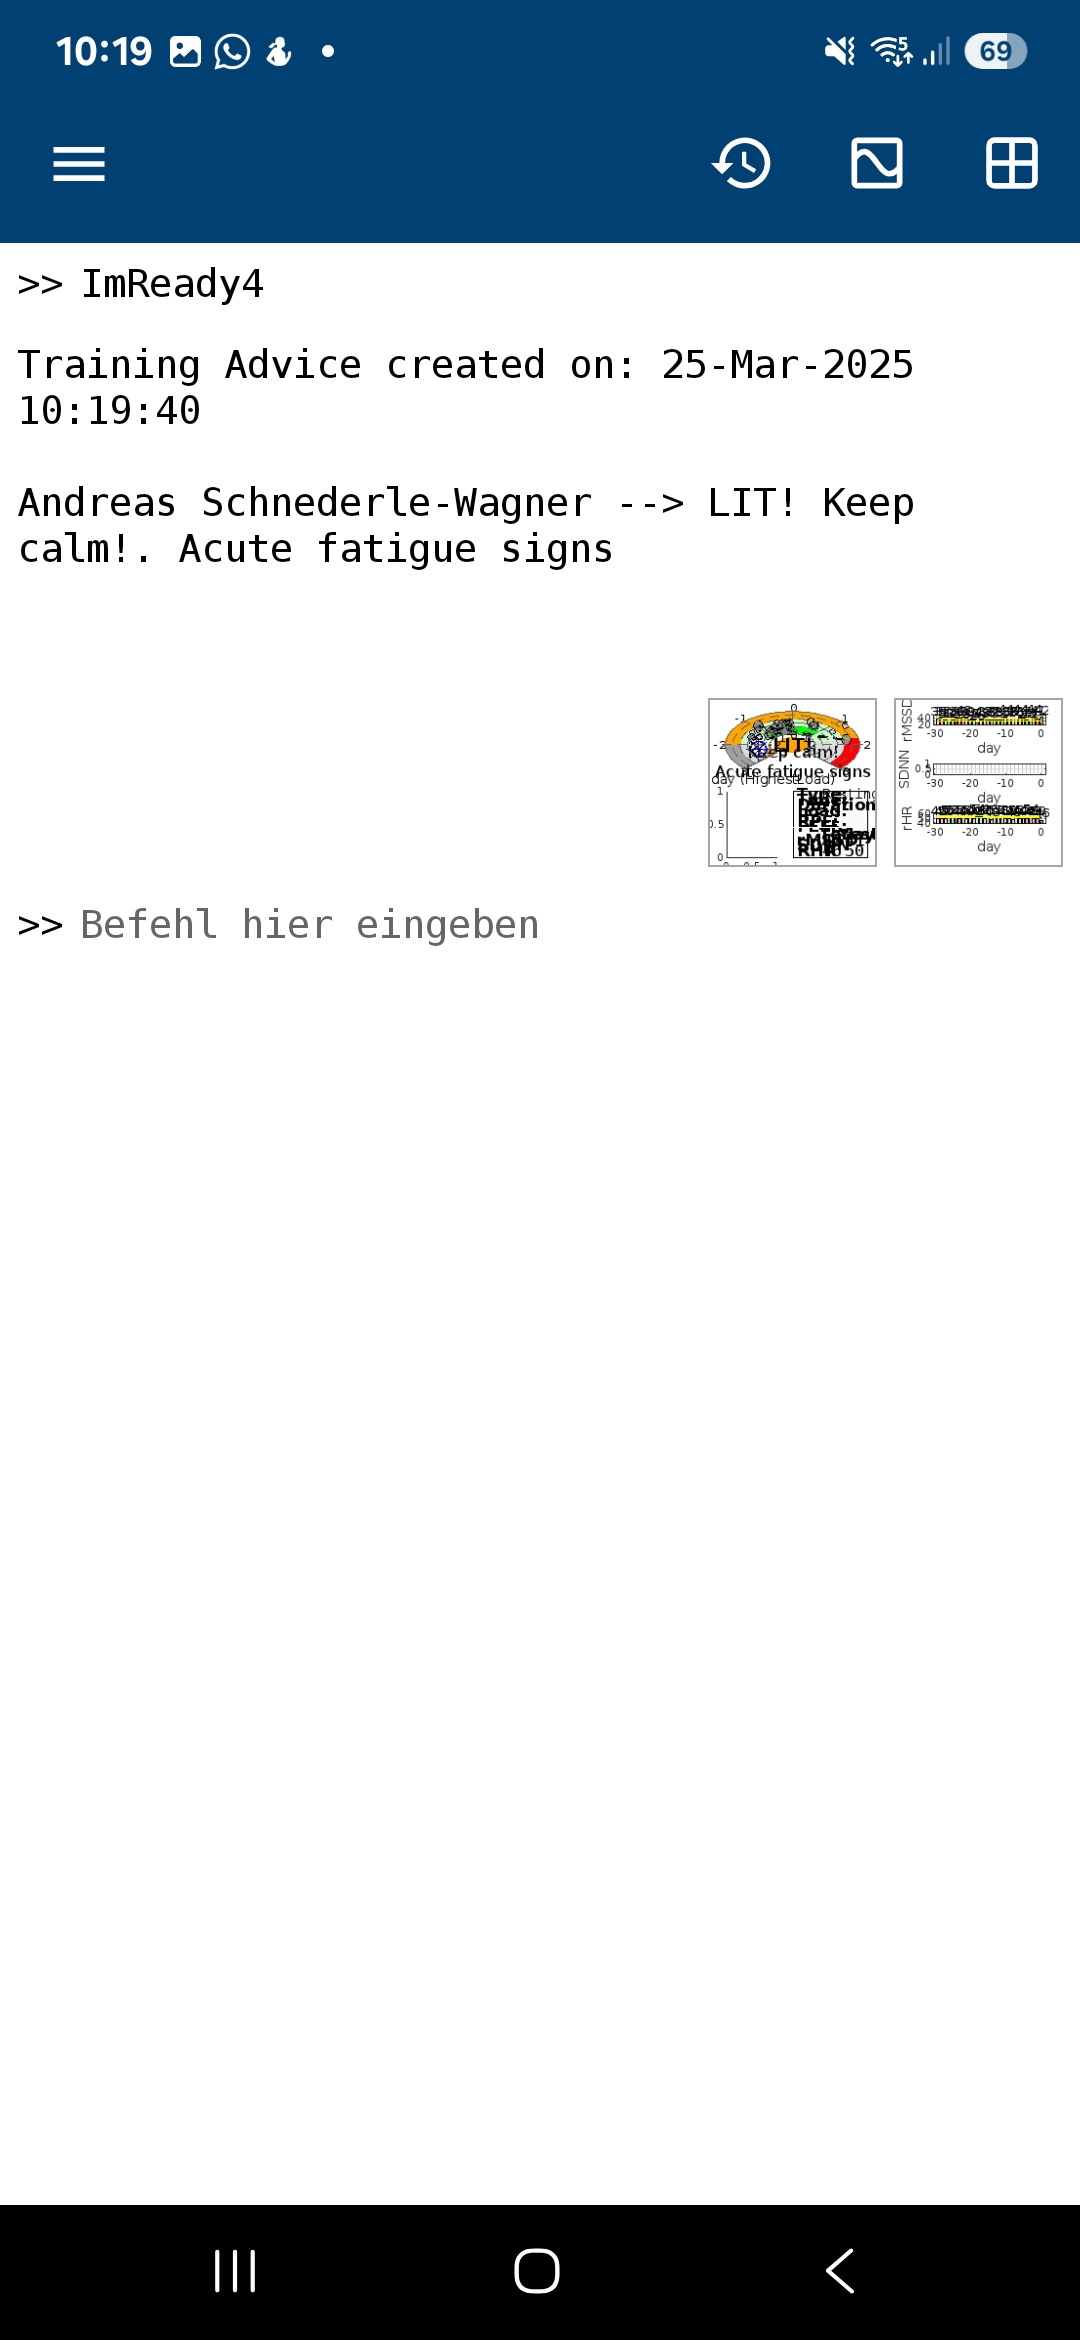
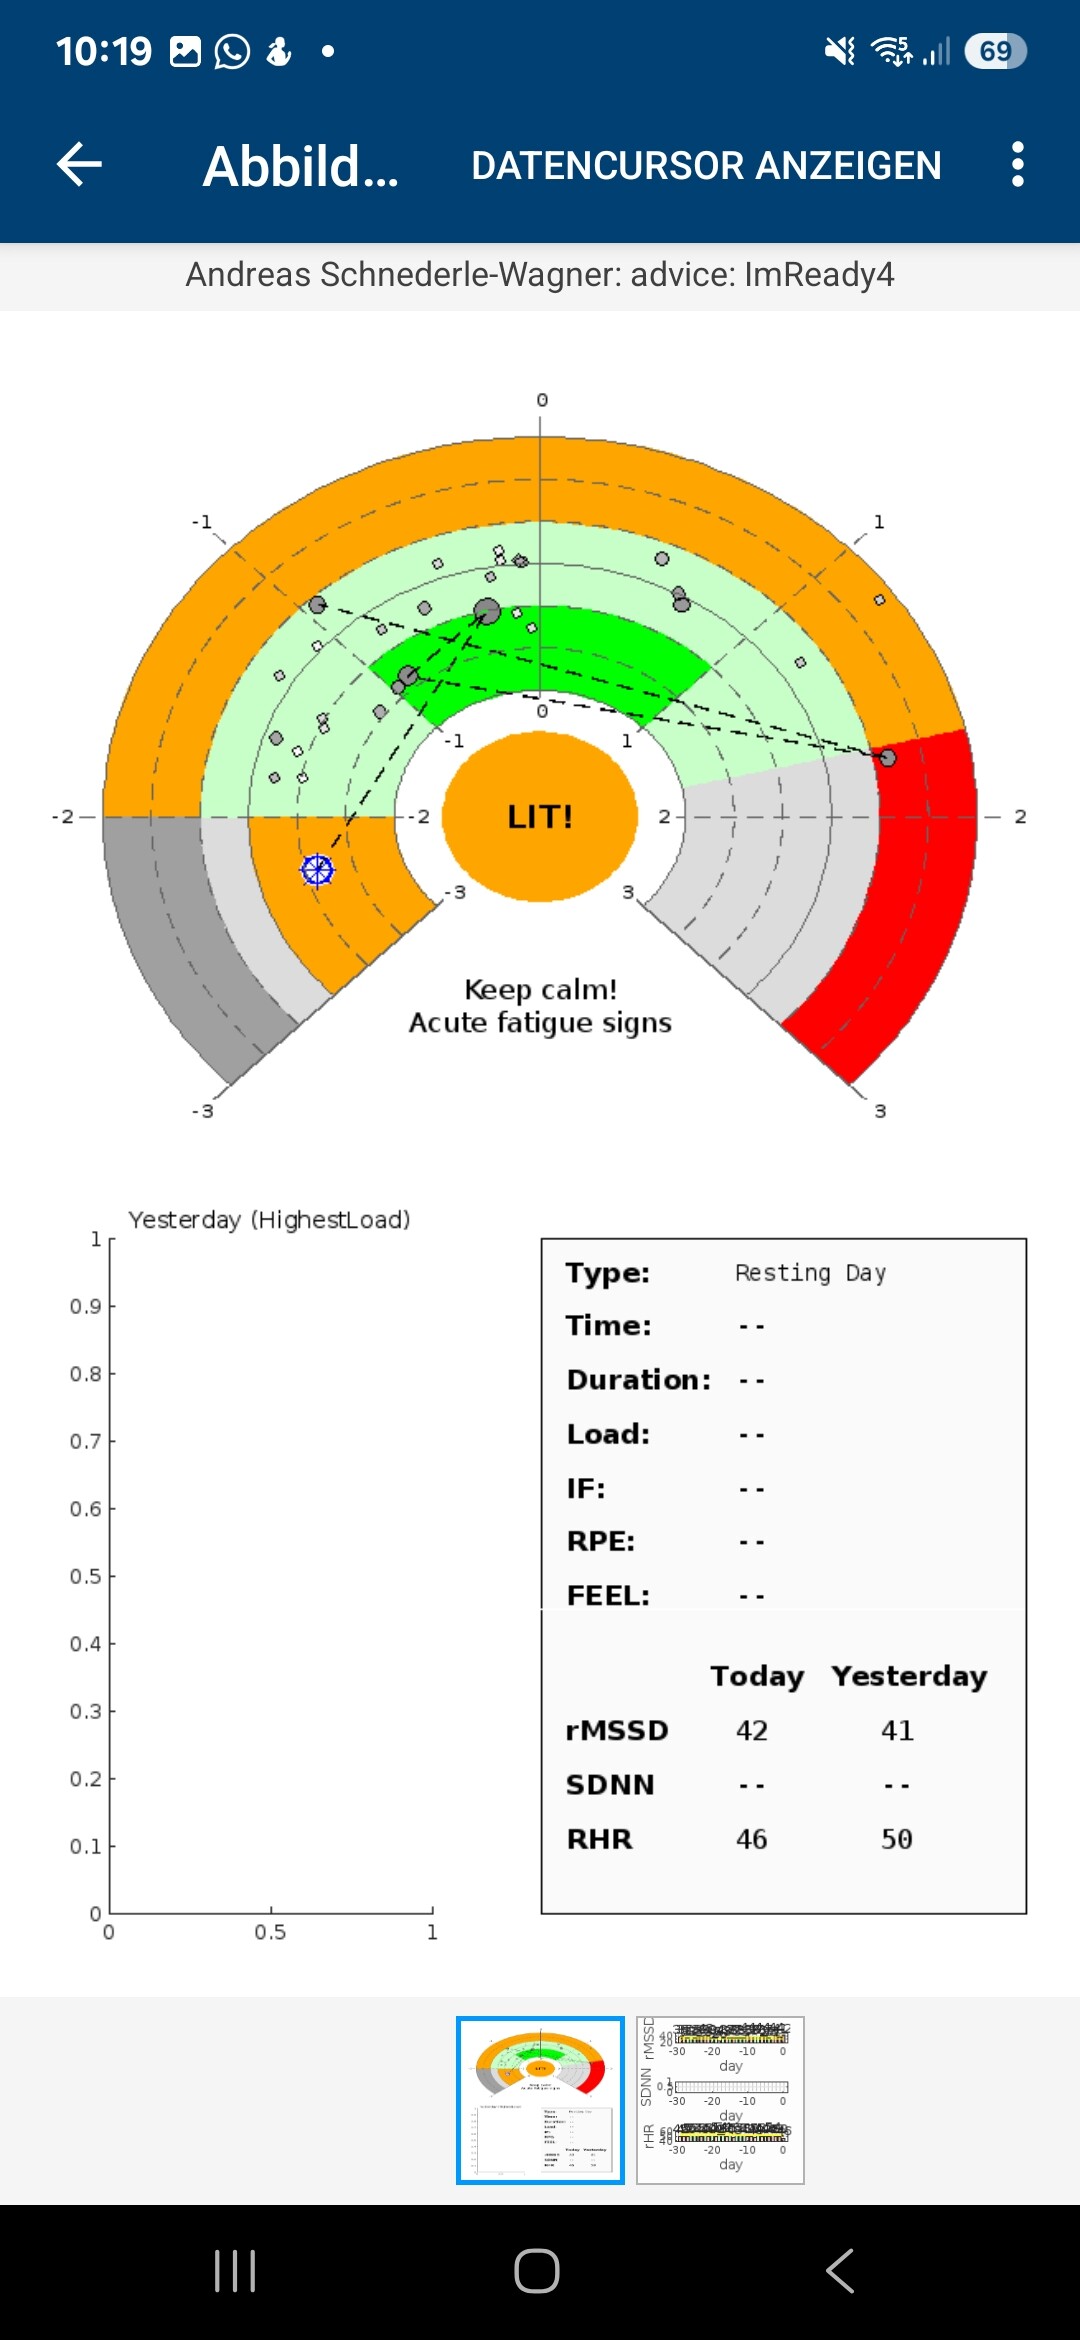
The reason that Imready suggests LIT is a lower than usual HR, while HRV would otehrwise be high enough for HIT. Like someone else said, go with how you feel. This thing with computer models is this: shit in, shit out. They cannot be better than the input data they receive.
High HRV outside of normal range combined with low resting HR also outside normal range, is known as a potential Acute Fatigue possibility.
Garmin just sees high HRV and low HRrest and considers this to be an excellent result… while this particular condition can be an edge case.
Now it is also important to consider when the measurements took place. Is this a morning measurement or an overnight result? If overnight, there could just as well be a measurement artefact in your HRrest. Garmin still looks for ‘lowest’ value???
As @Gerald says, when in doubt, follow your feeling.
Subjectively, I feel quite “normal”—not particularly tired, but also not exceptionally recovered. My resting HR was measured overnight by Garmin. However, I did have a higher-than-normal training load last week, which might contribute to the mixed signals from ImReady4 and Garmin.
I’ll probably go for a run this evening and decide spontaneously whether I’ll keep it easy or push towards the threshold pace that Garmin recommends, depending on how I feel.
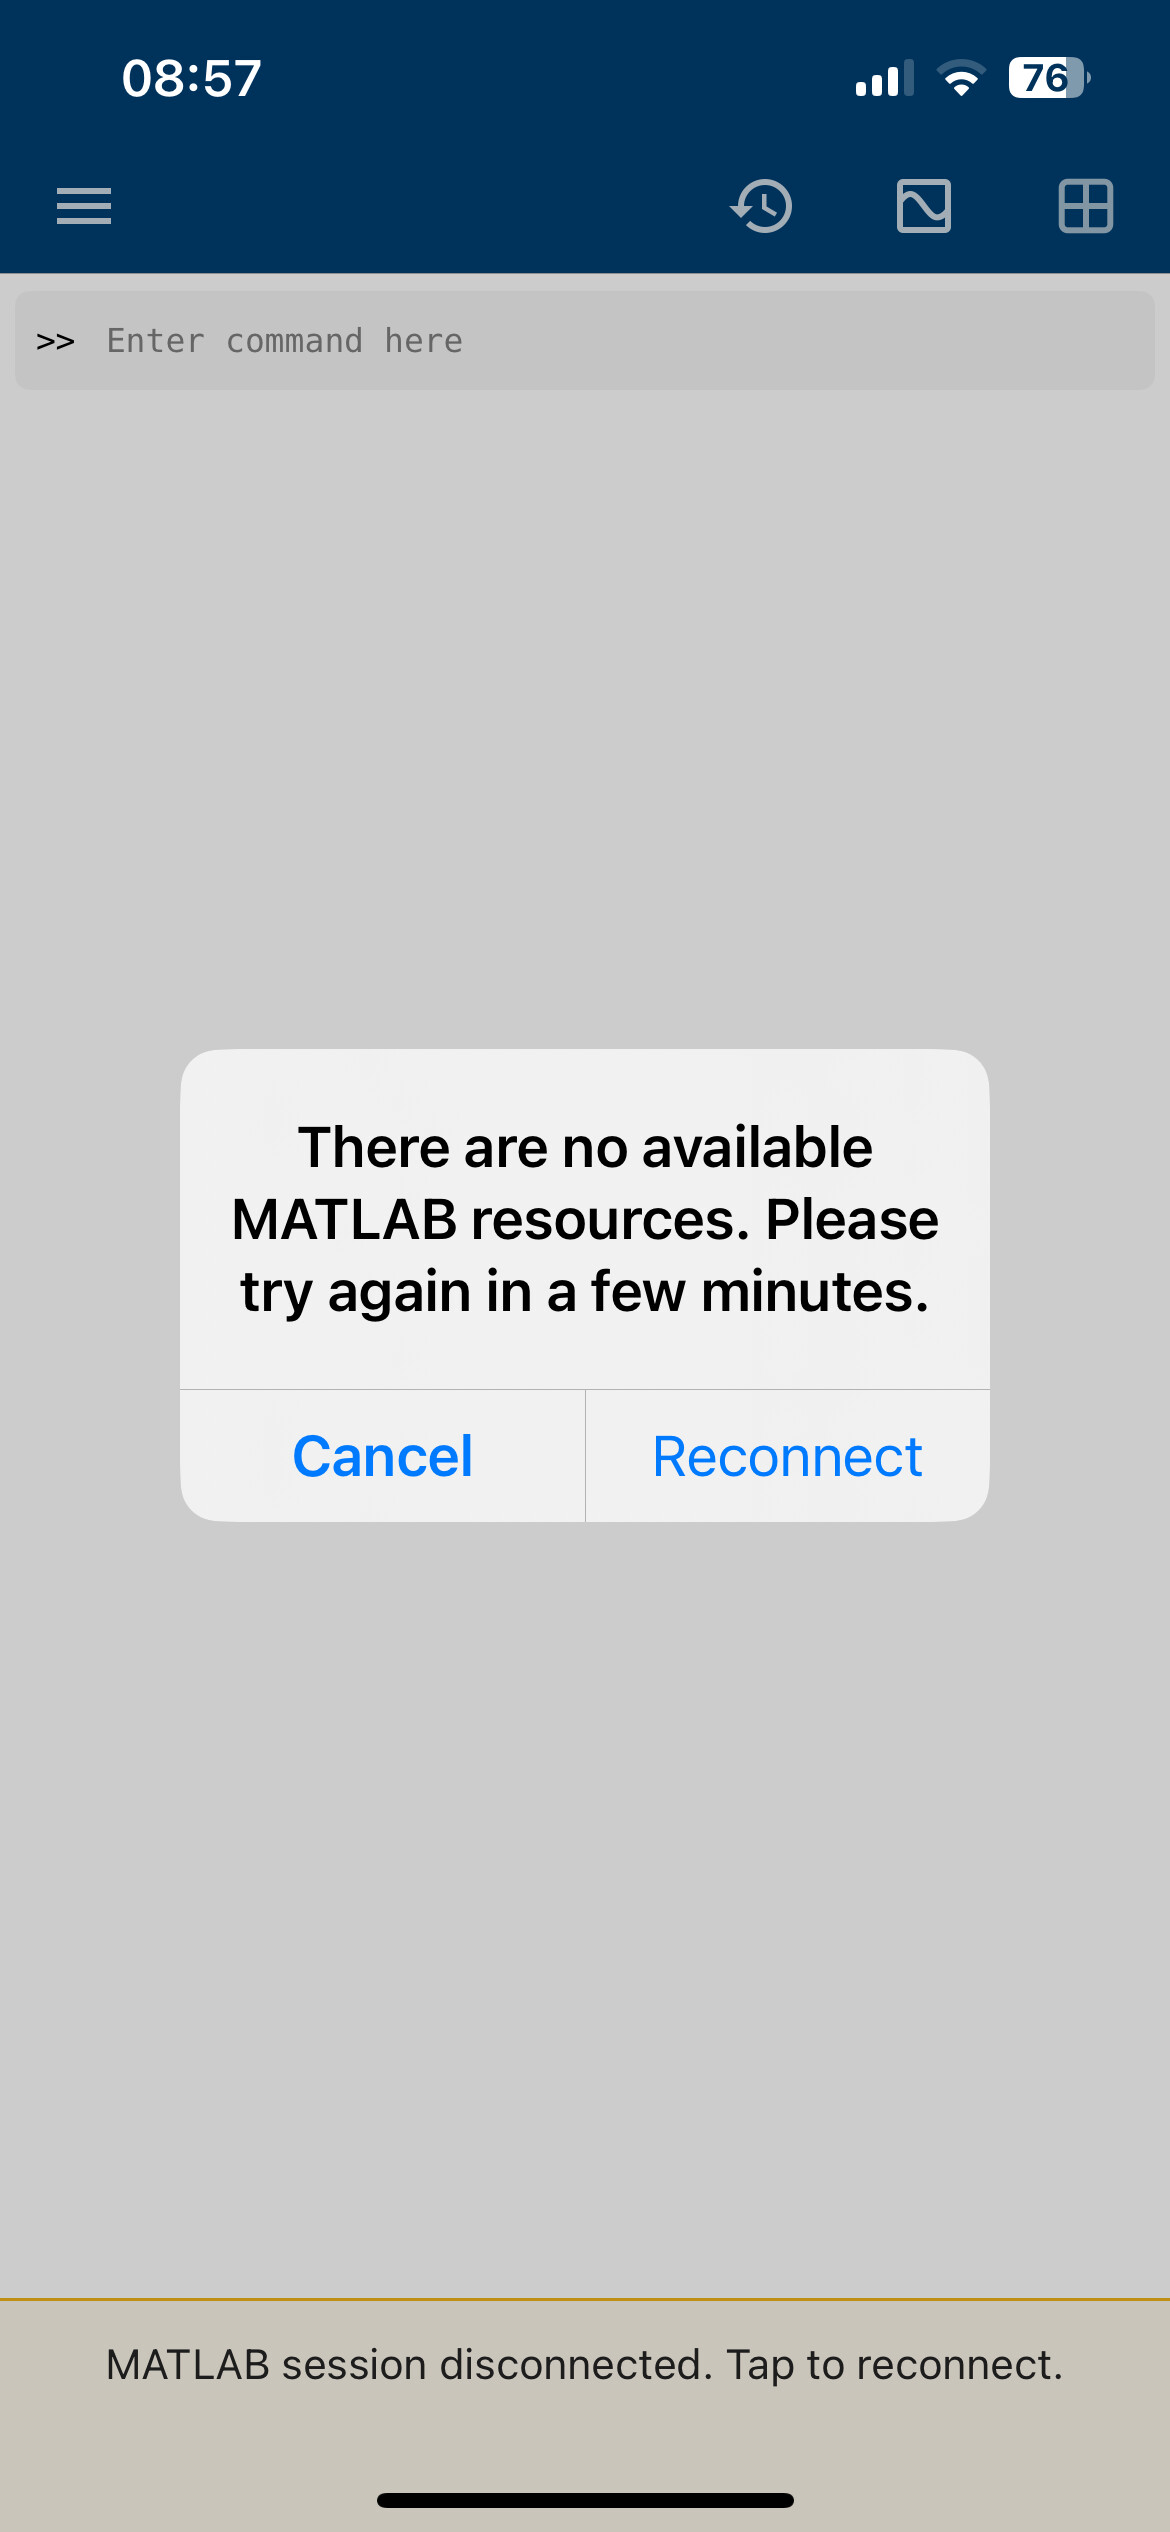
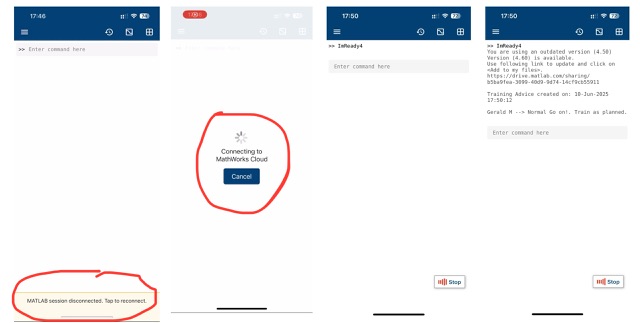
Happens often that the reconnect message appears (bottom of screen). Obviously today was an issue on their side, and not the usual disconnected message.
Fantastic work here. Coming a little late to the party here, maybe a year later!
I’m a very heavy user of HRV variables and interpretation, but all data is maintained in an Excel spreadsheet based dashboard. I have many graphs and I’m always interested in adding more plots to enhance interpretation. This is the first time I’m seeing the circular readiness chart.
I downloaded the Matlab tool and things work, just need to add some HRV data to Intervals.ICU. I’ll figure it out.
Try it yourself. Maybe I’m missing the recent news.
A few more questions that’s bothering me.
Is an HRV app derived “Train or Don’t Train” decision maker validated by research? Both genders? Different age groups? Here’s what inspired this question - Why We Stopped Relying on HRV Apps | Uphill Athlete
As HRV metrics like RMSSD tend to be non-gaussian, what graphical techniques are best suited to show statistics? When we talk about standard deviations and so on, we are assuming normality. Do you get my drift?
Thanks and sorry if some of these questions poke holes into the whole HRV interpretation issue which seemingly isn’t easy waters to swim in.
myithlete.com looks down. Haven’t checked the last couple of months, so can’t tell anything more about it.
On to your questions:
I’m not aware of any validation in research. But I strongly disagree with the Train or don’t train statement. The advice is much more subtle and I tried to describe that in my Excel version. Gender and age group should theoretically not matter because the center of the graph is a long term ‘normal value’ and not an absolute number. What could get you of on the wrong foot, is starting the data collection in a very stressful period, because that will lead to ‘normal values’ which are in reality not normal. And any improvement in HRV will directly result in the advice of HIT… Starting data collection during off season base training is probably a lot better.
Not sure where you are heading with that
Did you read the ithlete reply on that 2022 post? I have a similar experience. If my first HRV measurement goes wrong for some reason, I simply don’t do a second one because I know that it will not be meaningful. The reason why it sometimes goes wrong can be an uncontrollable gape, swallowing, unexpected noise, etc… Last Monday I had my most important event of the year. I did a measurement in the morning but did not look at the results (purposefully). I did great during the event, felt really strong and had a fantastic ride. When I checked the HRV result in the evening, it told me to ‘rest’. I sort of expected that, because the excitement alone is enough to throw off the result + the fact that I slept in a camper. So plenty of things that were taking me out of my normal routine.
During normal training routine, I’m quit happy with the results from the app. I do use the HRV4Training interpretation in parallel with the ithlete one. Most of the time, both interpretations agree, but not always. One thing that is way more clear in HRV4Training method, and is a first indicator to not overdo it, is the CV (coefficient of variation). A number is for most people easier to interpret. But the ithlete chart also shows it as a grouped bunch of dots compared to dots spread all over the chart.
If you have the data in Excel, the best way to get it into Intevals is to import using the CSV file import function, unless you know how to use the API (which I’m not au fais with).
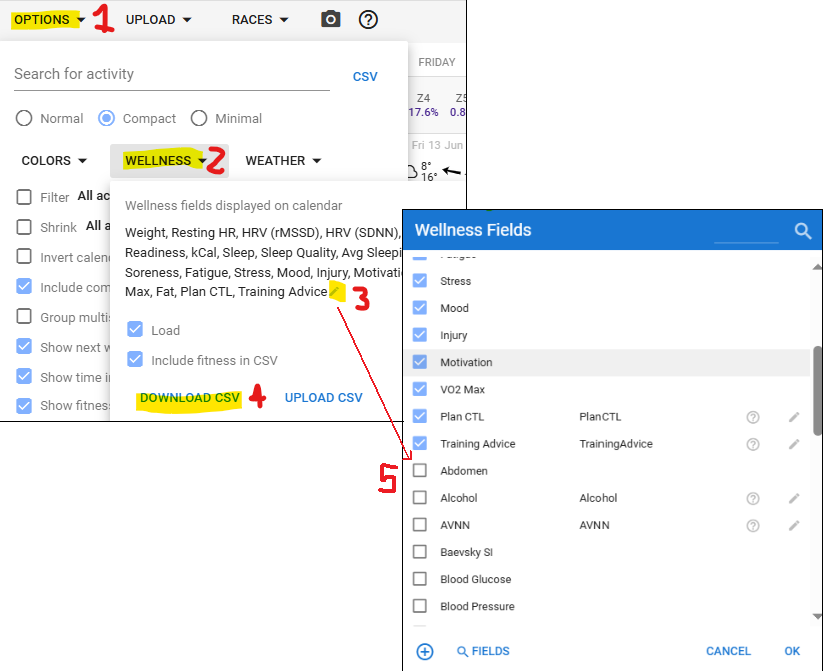
First export wellness data on the Activites page (calendar). Options (1), Wellness (2), Download CSV (4). This allows you to have a “template” layout/formatting for the import as the headers and certain columns are specific (not case specific, but title specific).
Click on the pencil icon (3) to open all the Wellness Field metrics, before you download. All items ticked display on your calendar, and only the ticked options download. Tick the unchecked boxes (5) for any item you wish to add to the download.
Click on download (4)
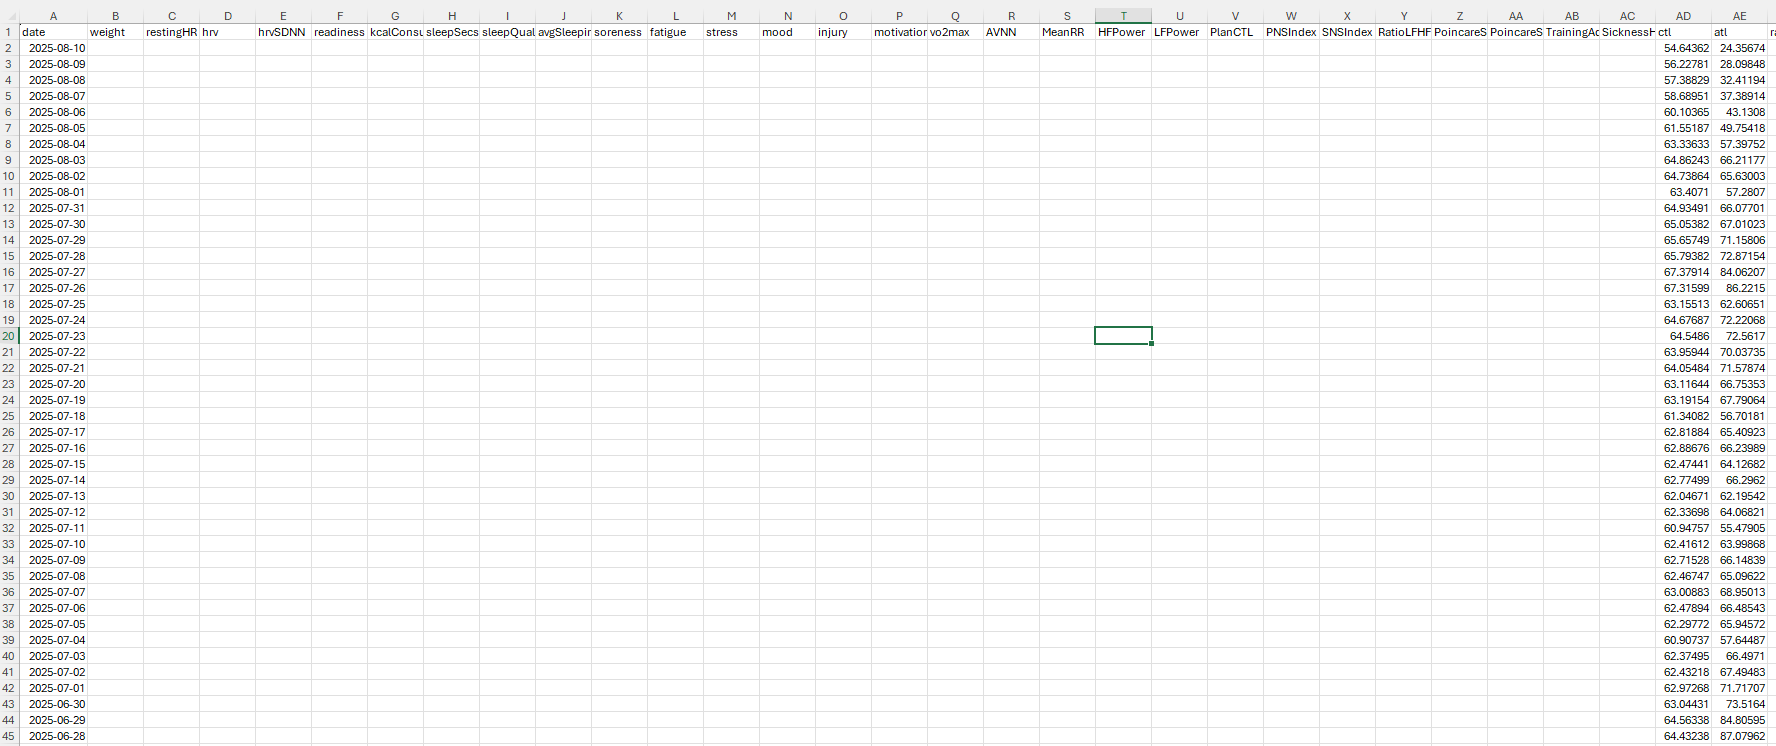
Open the Excel file, and accept the convert dialog box.
Change the date format to YYYY-MM-DD (this is format specific).
It’s sorted by newest to oldest, with 60 days into the future, displayed on top, so scroll down to see data. Keep the headers as they are, then populate your HRV data, and anything else you might have.
Import using the Upload CSV option (see image in step 1). If an error occurs, it’s possibly the date format that changes. Open the file, change the date format to yyyy-mm-dd then save and close. Then retry the upload.
Anecdotally, I used to use Kubios’ app and readiness tool on the mobile app with one of my athletes. He was the only one I monitored HRV. The client had the habit of getting sick quite often, infact even a mild acute stress like training would put his immunity so low that the he would get sick from sitting in the office close to sick co-workers. So the number of sick days he had were statistically huge, more than anyone else in my cohort of athletes. This is why I asked him to volunteer so I could check his HRV scores. I strictly asked him to use an ECG belt so he invested in the Polar H10.
Guess what we found over a 2 month period of monitoring? Several false positives. There were many instances when the HRV score looked great and the underlying advice was “recovered , ready to train” when infact the athlete was sick. He completely lost confidence in the tool and the whole process and stopped monitoring HRV.