I am looking to make a graph of the average power by duration, for example : 30s, 60s, 1 min, 5 min etc … of any ride or workout session
The closest one I can see is the Best Power that give the options to specifiy the duration. But this is the best power, not the average power for a given duration
I guess that the problem people have, @curve, is: what do you mean by the average 30s power for a session?
Do you mean the average power for every 30s of your session? If so, that is the same as the average power for every 60s, 5m, etc: that is, the average power for the session.
What is mean the average 30s, 60s 1m,
is that i have an interval program where i have for example 10 x 30s , 10x60s, 10x1m
at 125%. Id like to have the average Watt for the intervals of 30s, 60s and 1 min
LEt s say i made 2 identical intervals :
Session 1 : 10 x 30s , 10x60s, 10x2m
average 30s: 150w average 60s: 125w average 2m: 100w
Session 2 : 10 x 30s , 10x60s, 10x1m
average 30s: 160w average 60s: 140w average 2m: 120w
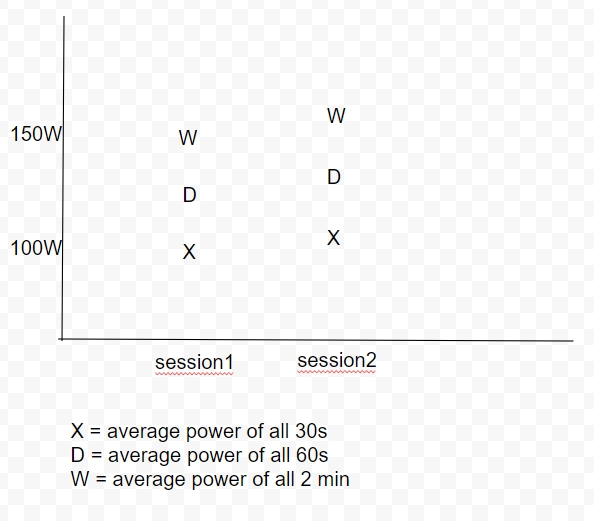
Id like to have a plot/ graph where each average power of 30s, 60s, 2 min of each session are represented as a point. so i can see how my power for each 30s 60s 2 min program from session to session.
Here a picture to illustrate it .
With that plot, i can quickly at a glance see that the averages of session 2 are higher
I don’t think that there’s a way of doing this in intervals.icu, curve.
Here is a way of doing it:
Go to your activity page. Below all the graphs you can view a table of the interval power, HR, cadence etc – for each interval. Make sure that you’ve clicked the “ALL” tab to get all the intervals. You can use the “FIELDS” tab to remove data you’re not interested in.
Then, use your mouse to select all the data in this table and paste it into a spreadsheet. I use Excel – the table is then just reproduced in the spreadsheet. {Alternatively, click on the “CSV” tab to get a comma-separated table that can be read into a spreadsheet.]
Thereafter, it’s a simple matter of calculating the averages you want in the spreadsheet arranging those averages in a column and plotting them or comparing them to some other session.
If you have a standard session, with the same number of intervals of each duration, then the spreadsheet calculations can be automated so that your time is minimised.
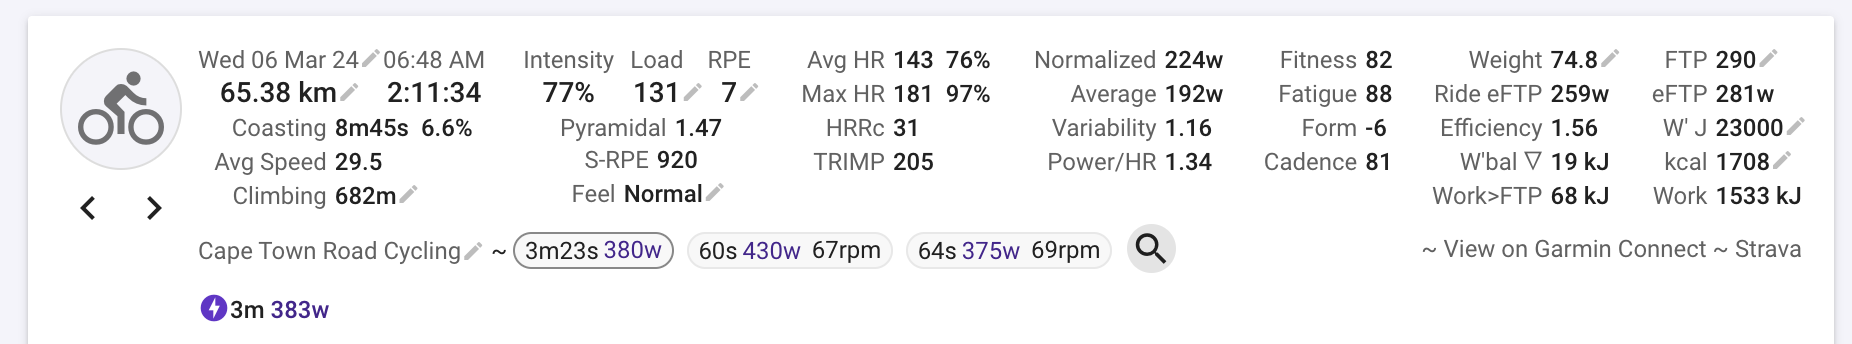
The search page will do some of that. It’s one of the oldest bits of Intervals.icu and a bit buggy. I am planning to replace it with something much more comprehensive. Anyway click the chip for the interval you are interested in, then click the search icon.