How to estimate Critical Power (or eFTP) and W' with intervals under 3 min (my first web app)

Interesting result… I use this model for running. Actually, I run more than I cycle these days. My power profile on the bike and my speed profile for running are quite similar.

This is something I’m curious about, but I haven’t found much published information on it: the correlation between a runner’s speed profile and a cyclist’s power profile (for those who do both sports).

As you note, it’s highly sensitive to exactly which input I give from my power curve. I’m sure much of the curve I haven’t really gutted out a max effort. Choosing high/corner inputs, I can get CPs anywhere from 250 to 271, vs. Intervals eFTP and LT2 of 253.

Your model’s W’ values vary from 11 to 15K, vs. measured W’ balance drops of 25K. (But I don’t think any of these hyperbolic models are going to represent the results I’m getting.)

It looks as if the time asymptote is near 0 seconds. If so, shouldn’t there be a degree of freedom to move the asymptote (time with theoretically infinite power) to a negative number? Following the example of [Morton 1996], I’ve used k values of anywhere from -24 to -72 seconds to get best fit (visual and least squares) against my actual power curve.

The hardest part, it seems, is deciding what constitutes a maximal effort. I always end up analyzing my curve to look for the points of greatest effort; I don’t typically input predetermined durations. I always choose by looking at my curve. And I can get a good sense of my CP through RPE, so I quickly know if the estimated curve makes sense or not. But this is difficult to automate in the online application for now (at least for me). As I mentioned before, it’s a tool, but it can’t be used blindly, and it probably won’t work for everyone.

It’s not my model :slight_smile: . All credit goes to Morton; it’s his 3P model. I just made the online tool. Yes, k is calculated based on the input values from the tests.

Thanks for putting this up!

This lead me to build a spreadsheet model (lmk if you’d like to look) to fit Morton’s model against an export of my entire Intervals power curve. It requires manual, iterative gradient descent on the three params, minimizing RMS error.

I get:

  • CP = 252w (about right)
  • W’ = 18,450 (36% below observed drop)
  • k = -22.5s (whatever that implies)
  • RMS err = 41w (too many intervals where I haven’t done max effort)

Those are also close to what Intervals gives me (and what Intervals’ model curve says about my being a wimp over longer intervals).

3 Likes

I actually thought about this yesterday myself… using the power curve from Intervals.icu for the last 42 days for the estimation… but like you, I have few maximal effort intervals (I rarely do them). Using multiple submaximal points from the curve would create a false estimate. It’s quite easy to detect my maximal efforts on the curve.

But it’s not so simple on a friend’s curve who tried the test yesterday…

He failed the 60s interval (he actually did an 18s peak in that interval) and did a submaximal 3 min (299w for 3 min, when a few days ago he did 307w for 3min50s). If he blindly uses the 60s and 3 min data, the estimate will be terrible… if he uses sprint + 18s + 3min50s, the estimate improves… but I still think it would be better for him to repeat the 60s effort more uniformly. It’s not so simple (for me) to automate the detection of what would be maximal and what wouldn’t be.

image

Adding to this…

I’ve included some fat and carbohydrate oxidation estimates (at Fatmax intensity). It’s a decent guide for energy replenishment during long Zone 2 training sessions.

1 Like

Hmm, interesting problem.

Here’s my model (blue) to Intervals.icu power curve (red). The “corners” of maximal effort stand out visually, especially around time intervals that correlate to hills on my usual routes.

But I suspect that isolating those max effort points would create a modeled CP well above anything I could imagine sustaining for 20 or more minutes. Or maybe I’m a total wimp!

I’ll just have to try to fill in the dwells.

Intervals power curve CSV dumps include columns labeled FFT_CURVES, presumably representing their “model” for each date range. Subtracting that from the power curve helps distinguish max efforts (blue below), but not quite enough to allow simple local-max selection.

1 Like

I wouldn’t say that… the model accounts for physiological failure at maximum intervals, but it doesn’t consider psychological failure. Each person has a pain threshold, and the test will have difficulty “seeing” that. I myself generally end my “maximum” intervals a little before the actual maximum. I just don’t have the will for that much suffering anymore… Probably in a race, I could tolerate a bit more effort…

I’ve also found that there is an element of skill with doing short maximum efforts.

I’ve added some more utilities to the tool…

Estimated energy expenditure from fat and carbohydrates according to intensity.

User category comparison (based on FTP w/kg) compared to the same age group and gender.

Racing profile according to the characteristics

The data are approximations based on what I found online from estimates for Tadej Pogačar (above) and Wout van Aert (below).

Marcelo

4 Likes

Awesome, how does it compare with
Kona Endurance Run Performance Analyzer?
and Modelling Human Performance - #20 by GarageLab? Mader / Inscyd model

Thank you.

To be honest, I haven’t done a direct side-by-side data comparison. My assumption is that we’re all starting from the same foundation, which is Mader’s model. The real difference usually isn’t in the model itself, but in how each platform gathers the data to feed it.

Ultimately, I believe all these sites/platforms are trying to estimate MLSS, VO2max, and VLamax. However, I’m not very familiar with how they specifically estimate these values or which constants they choose for the model’s variables.

Perhaps one key difference is that I am using a model that estimates critical power from one longer test (3-20 minutes) along with two short tests (under 60 seconds each).

1 Like

And the 20’’ max test is not used in either short test, in contrast with other web VLamax tests that require it. Can you add it to the anaerobic effort interval range? Otherwise it will be difficult to compare the results.

I quickly checked the Kona Endurance Run Performance Analyze and the GarageLab spreadsheet…

Regarding the Kona Endurance Run Performance Analyze:

I tested a few combinations, varying the input data, and what I noticed…

  1. MAX Pace during 20sec SPRINT did not influence the VO2max, VLamax, or running economy data at all.
  2. Running economy seems to be calculated from the heart rates during the effort and the maximum HR.
  3. VO2max is estimated using the Cooper test formula: VO2max = (12-min test distance - 504.9) / 44.73.
  4. Glycogen reserve is purely dependent on weight.
  5. At least in my tests here… keeping the 12-minute test speed constant and making the athlete faster in the 6-minute test resulted in a lower VLamax… which, to me, makes no sense at all. Likewise… if I fix the 6-minute test and make the athlete faster in the 12-minute test, the site estimates a higher VO2max (OK… they covered a greater distance, which is what it uses in the Cooper Test) but it increased the VLamax… which, again, I don’t think makes sense…

Regarding the GarageLab spreadsheet (which I’m not familiar with, but it seems to be from someone well-versed in physiological models):

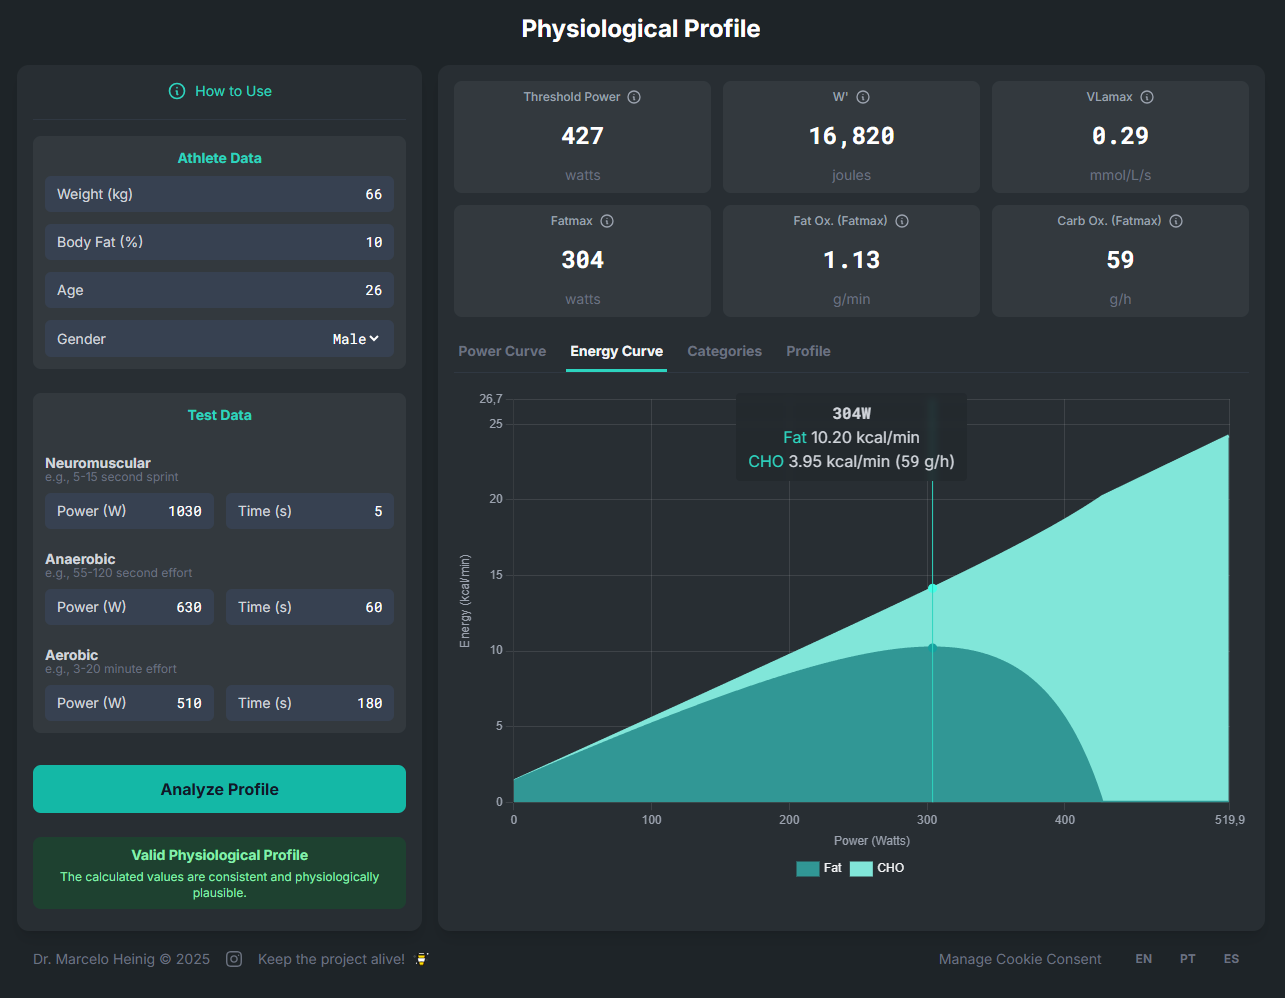
It appears to be based on the studies of Hauser and Mader, calculating MLSS from VO2max and VLamax. The problem is getting these VO2max and VLamax values for the input. Furthermore, it also varies some values (ks1, ks2, ks4, and other variables according to the reference study used). If I use the same VLamax, VO2max, and other constants from the GarageLab spreadsheet, it seems to me that we arrive at the same carbohydrate and fat oxidation curve (I say “it seems” because I looked at it quickly and his spreadsheet is quite complex).

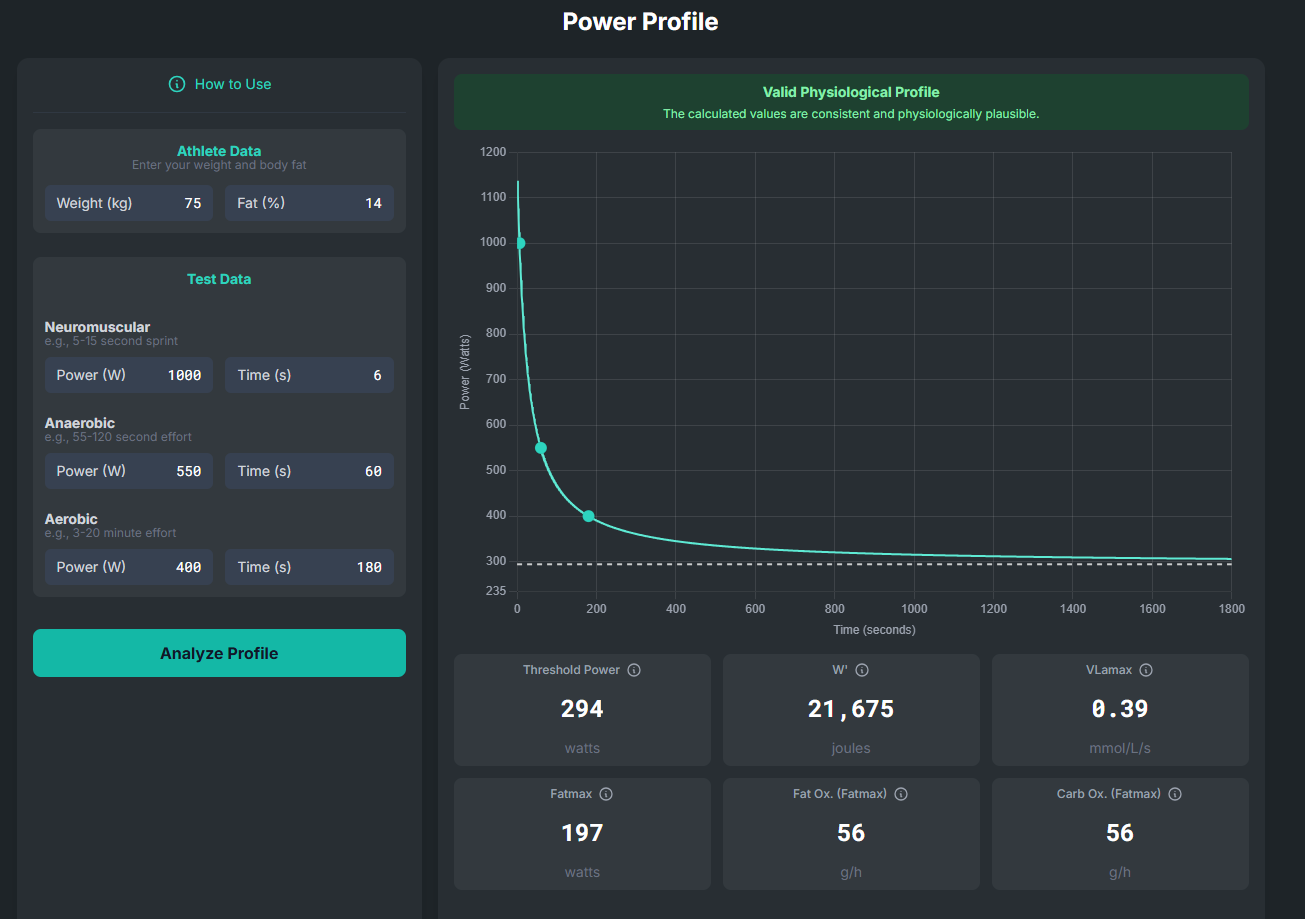
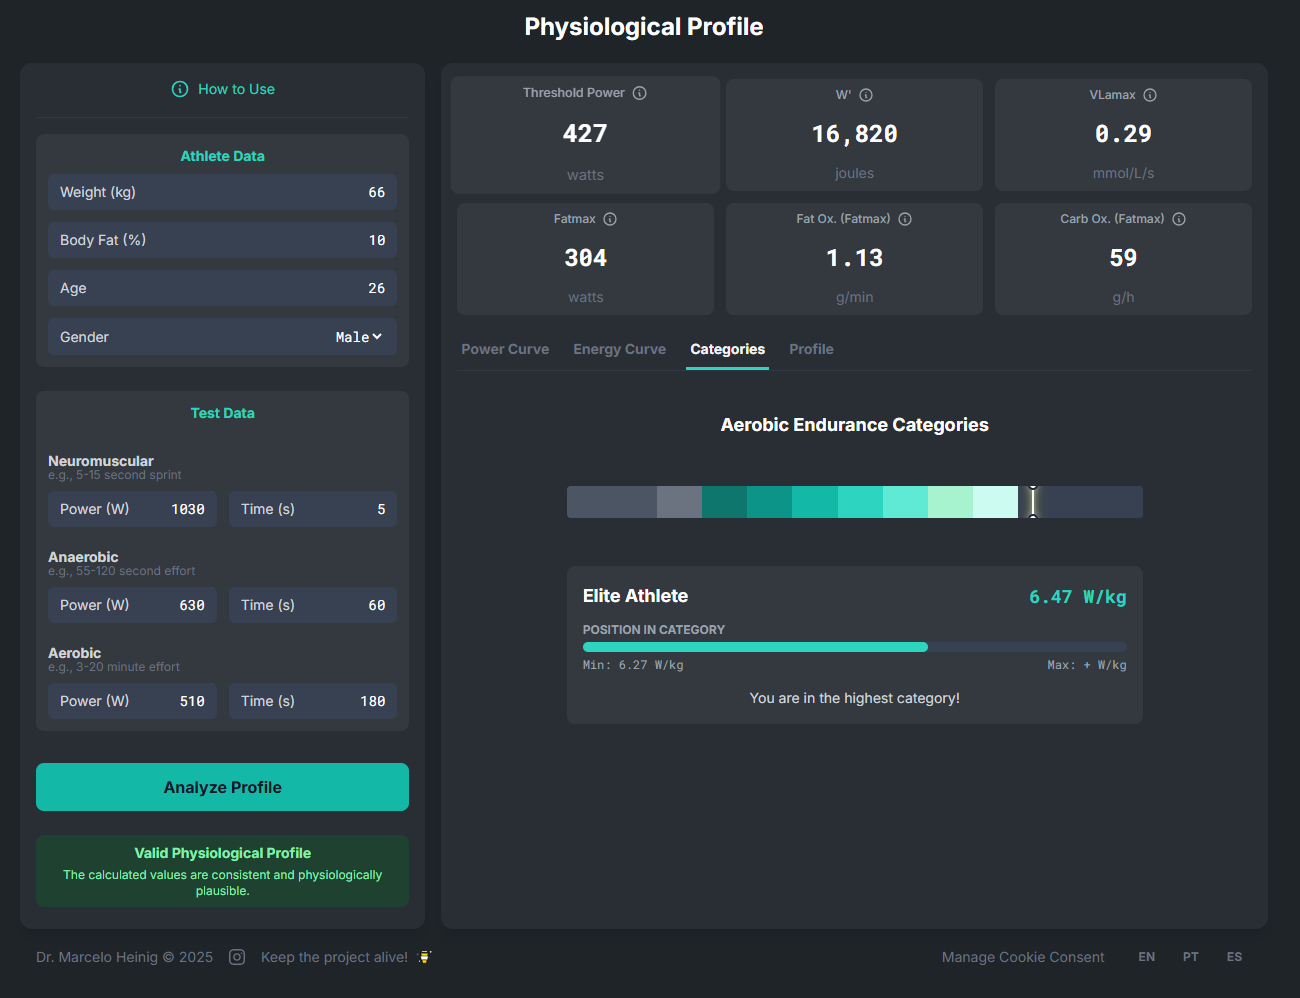
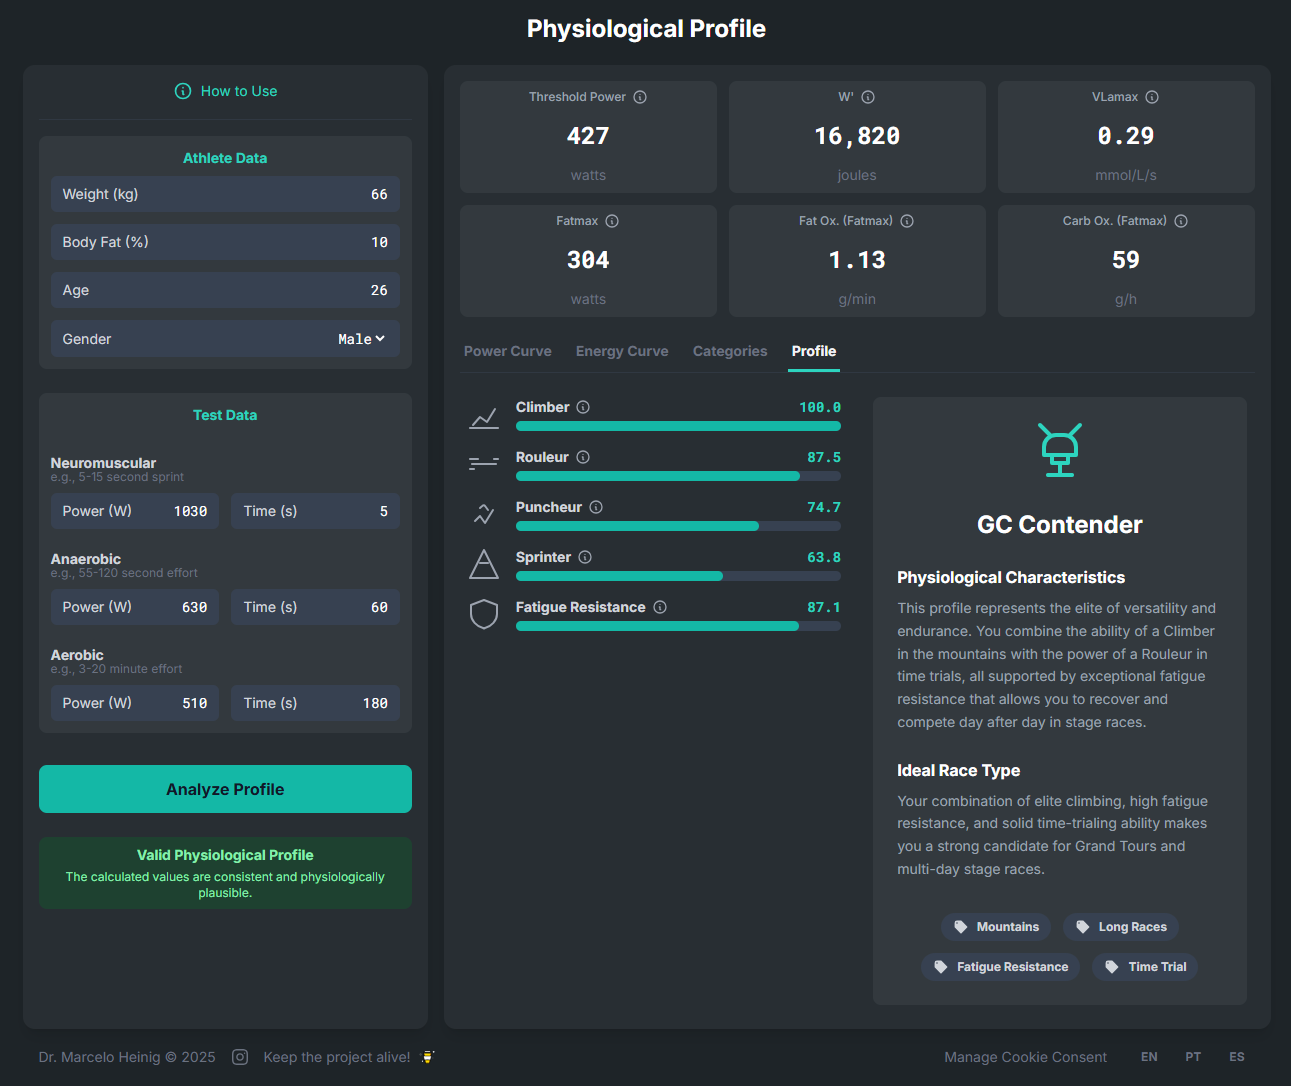
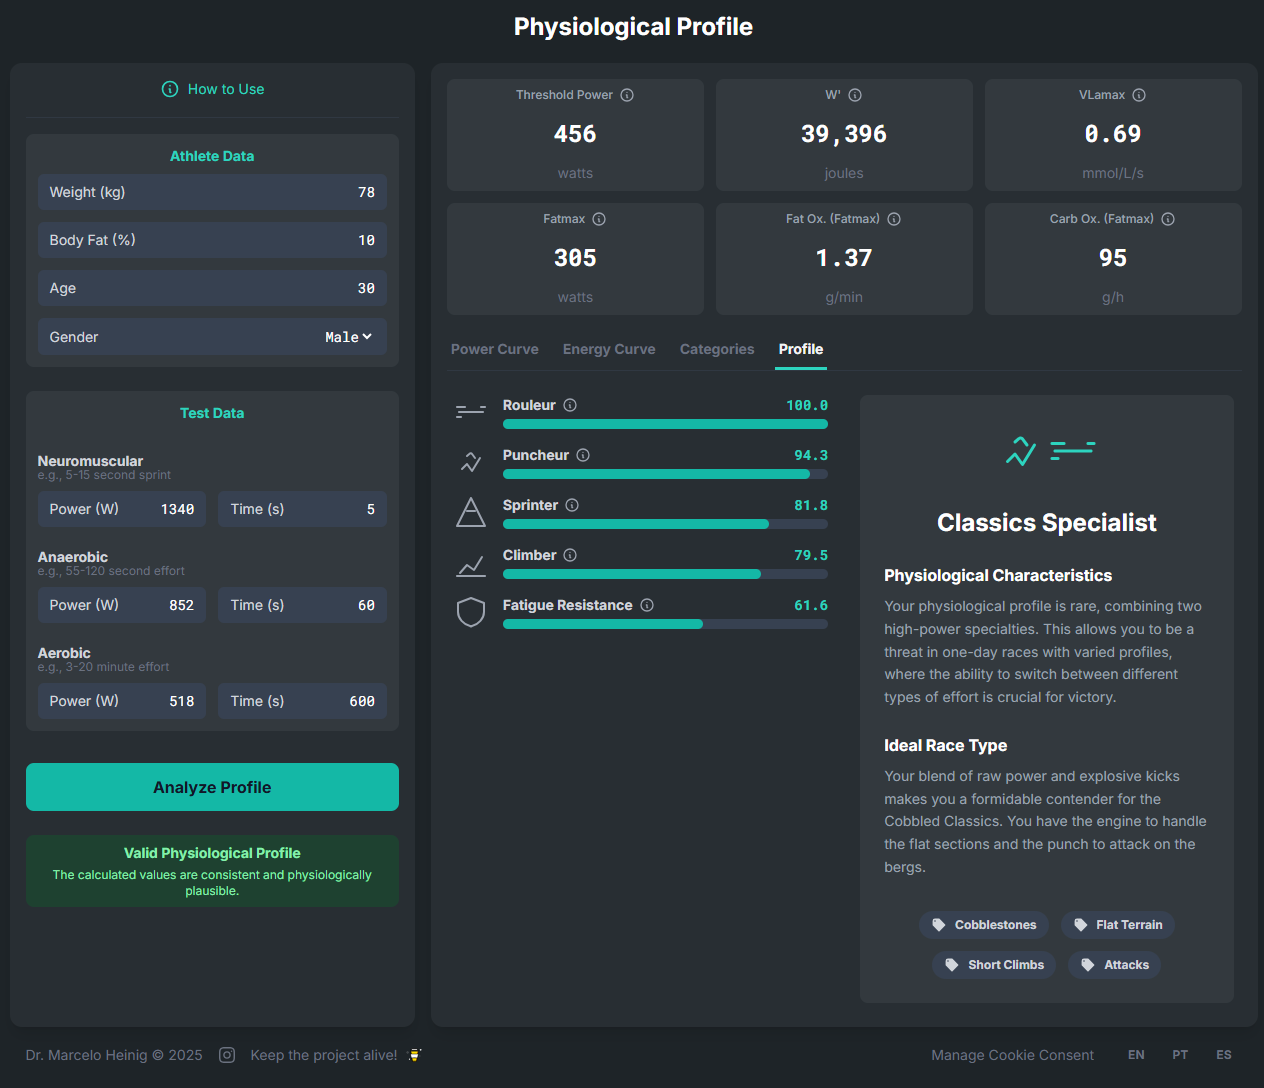
Furthermore, I recently compared the calculations from powerlab.icu for an athlete with the profile below with a German platform.

79 kg, 54 years-old, male

5s 1042 watts 60s 637 watts 720s 330 watts (the German plataform uses 20s, 3 min and 12 min if I remebber correctly but I do not have the data)

The result from the German platform was a VLamax of 0.25 mmol/L/s, and on powerlab.icu it was 0.78 mmol/L/s.

It’s difficult to compare without knowing how other platforms perform the calculations, but (in my opinion)… a VLamax of 0.25 mmol/L/s makes no sense for a 54-year-old man who generates 637 watts in 60 seconds. He is clearly glycolytic. Where does the energy to generate those watts come from if not from glycolysis in 60 seconds? Interestingly, the athlete underwent a calorimetry test that had already shown high carbohydrate oxidation at rest and at low intensities.

Thank you for detailed and clarifying explanation.

FWIW almost a decade older, 5 years ago had INSCYD VLamax of 0.29 mmol/l/s, and WKO reports “glycolytic capacity” of around 0.5 kJ/s. 5-sec power around 1050-1150W, 60-sec power around 480-540W.

Found the calculations for Kona Endurance Run Performance Analyze: GitHub - konaendu/vlamax: VlaMax Calculator

2 Likes

The problem is that this model is reasonably complex and requires a bit of mathematical and physiological knowledge. Even in published articles on the subject, you see some constants being used incorrectly. In the end, they are just estimates, and the ideal is to have a lab-measured VO2 and a reliable MLSS. I personally don’t think using a sprint to estimate VLamax is a good method (emphasis on “estimate” because it is an estimation, as there is no way to truly measure VLamax). Ultimately, it’s good to check these estimates against reliable data to see if they make any sense. If they do, keep using them… if not, ignore them… As an example, I mentioned the case above where the VLamax was estimated at 0.25 (sprint a little over 1000w and 60s at 637 watts), and the calorimetry is not at all compatible with that VLamax… In that case, it’s better to ignore that estimate. INSCYD says on their website that elite marathoners have a VLamax of 0.3. This athlete who had a result of 0.25 is far from the profile of a marathoner in real life.

1 Like

All seems pretty reasonable to me, although I’d guess that my fatmax is higher. FTP estimate matches WKO5 exactly, but my FRC is only 15.3kj. I don’t know how FRC usually compares to W’ though.