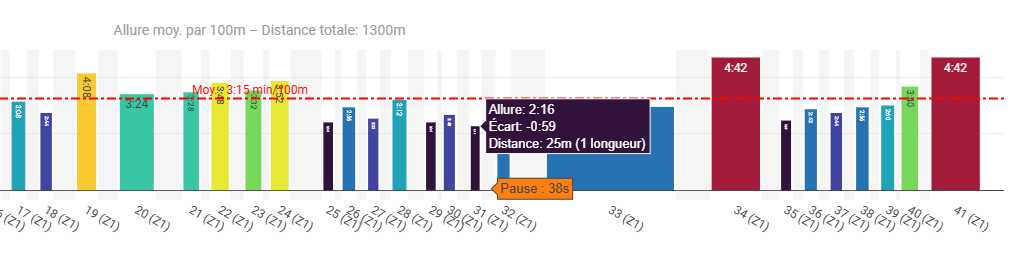
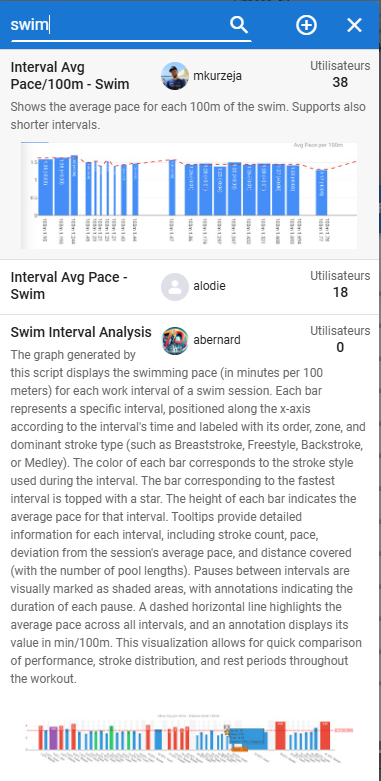
I have created an activity chart for my swim sessions that allows me to visualize not only the paces but also the distances and number of lengths completed for each interval, with information about distance, deviation from average pace, and number of lengths included in the tooltips that appear when hovering with the mouse.
Each bar is colored according to its pace value on the color palette. I have also added a subtle greyed-out area for each recovery or pause detected between two efforts. When hovering over this area, a tooltip displays the duration of the pause.
I would like to add the type of stroke (breaststroke, freestyle, or backstroke) detected by my Coros watch, but I don’t think this data is collected by Intervals.icu, or perhaps I don’t know the name of the variable stored in the database.
It is not implemented by default but you might be able to add it as a ‘Custom Stream’ if it is in the FIT file.
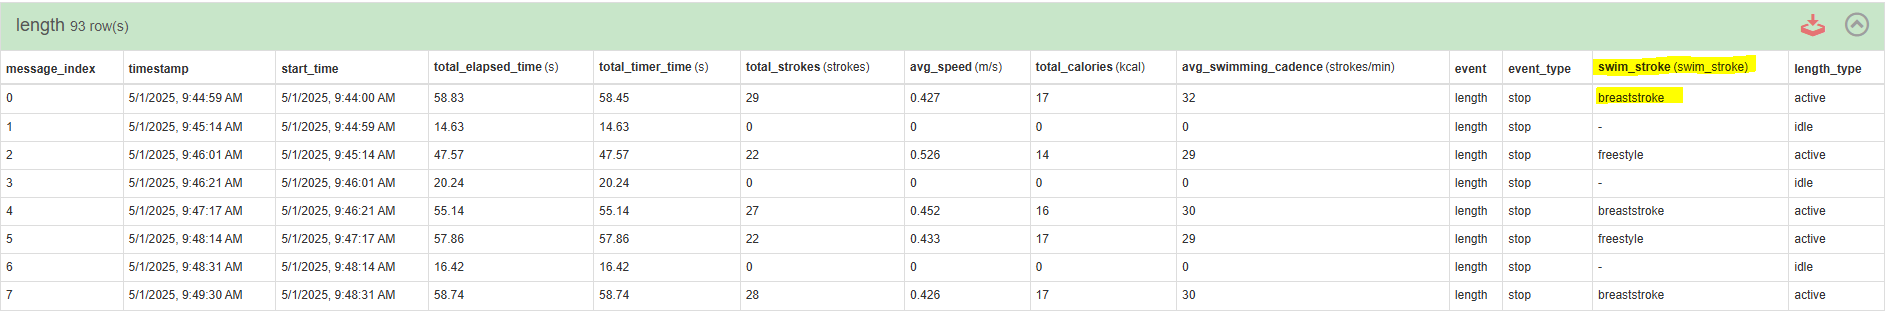
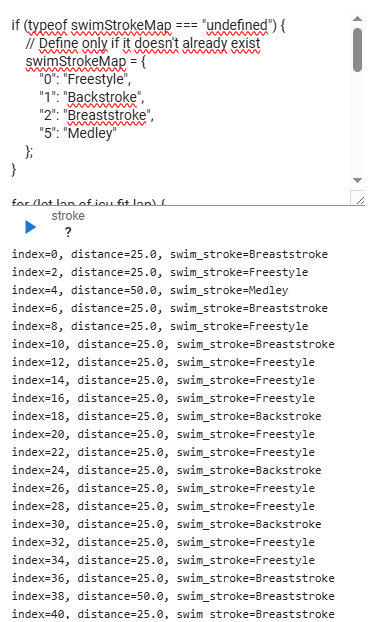
First check the FIT file with FitFileViewer.com to see if you can identify it.
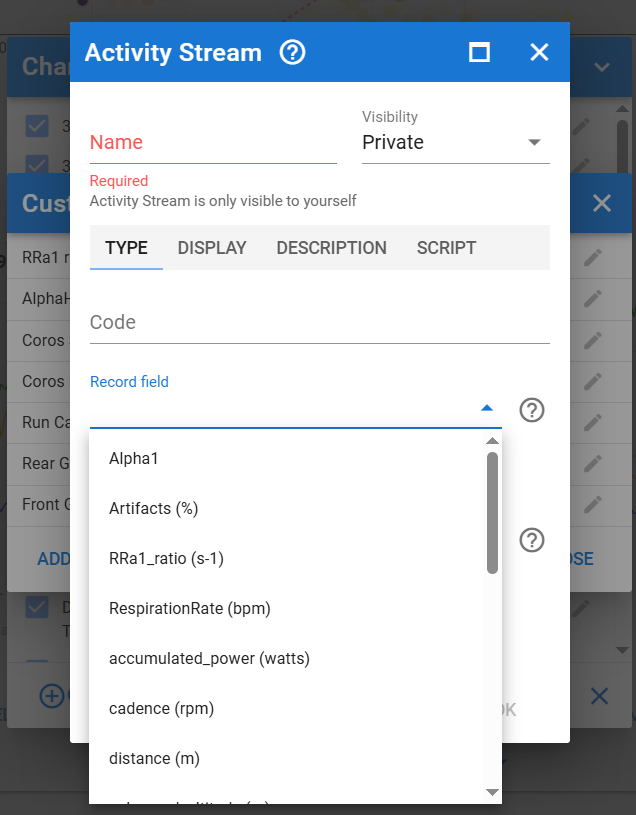
Then in Intervals, go to Charts, Custom Streams, Add Stream and see if it is listed in the Record Field dropdown.
let strokeType = iv.swim_stroke || iv.customFields?.swim_stroke || "Not specified";
I tried to add code to retrieve this information, but without success.
Custom field scripts for intervals do not appear to have direct access to the “length” messages in the FIT file (where swim_stroke is located).
The structure of the objects accessible within the interval script only provides access to interval properties, streams, and certain activity aggregates, but not to the raw “length” messages.
Thank you @R2Tom for this idea.
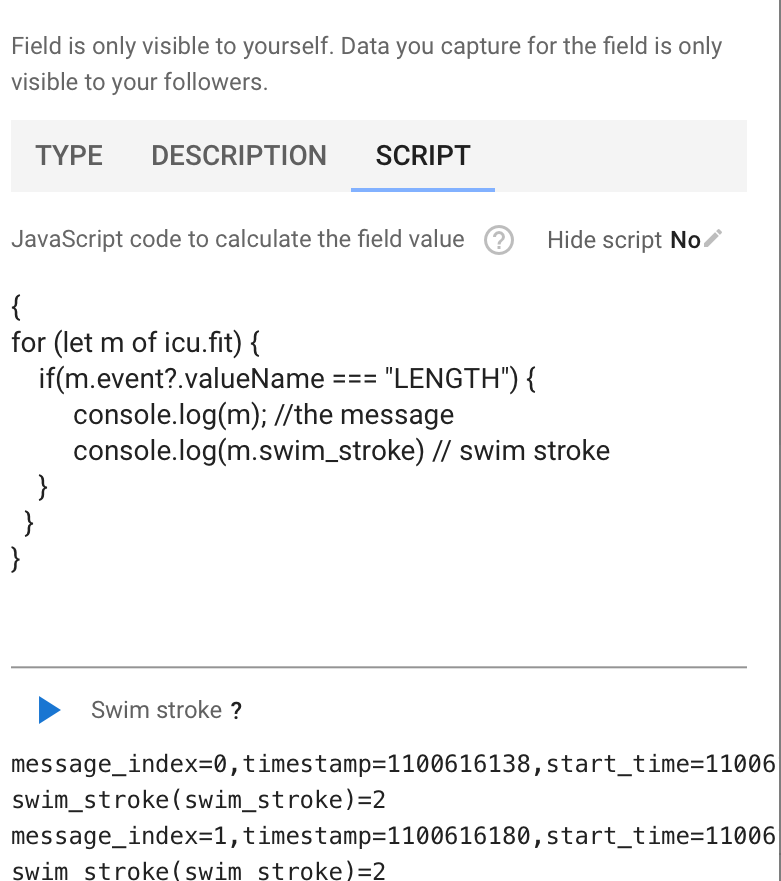
Admittedly, in the interval field editor, I can collect this data from icu.fit, but I can’t use it in my activity chart script-or at least, I don’t know how to do it.
Yeah, that’s a current limitation of the activity charts they do not have access to the fit part of an activity. Would be great if that cloud be possible some day @david
The only workaround I am aware of is to write the necessary parts in a custom field. From the activity chart you can then read the custom field.
Yes everything in the fit file is only available to custom streams and activity fields with the “Processes fit file messages” box ticked. And these only run when the file is re-processed, not just analysed. Intervals.icu keeps the original file in slow cloud storage, and only summary info in a local database. Currently Intervals.icu has more than 16TB of data in cloud storage. Thats way too much to keep in a local db.
@Urs_Leuthold
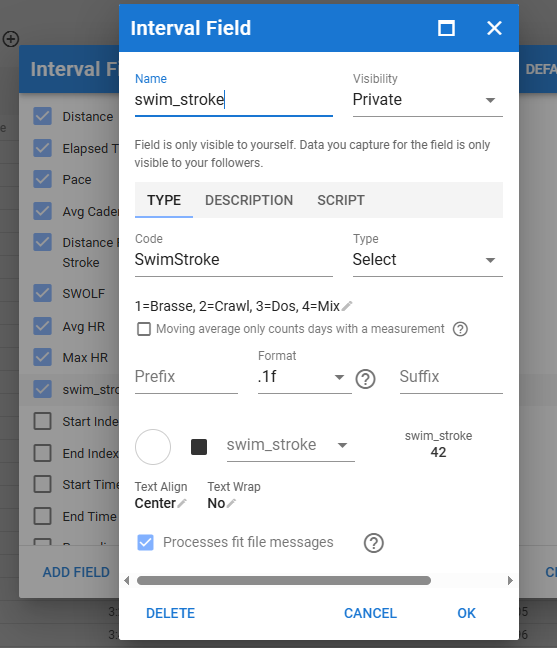
You need to add a custom interval field, include it in the data tab, and manually select the swim stroke from the dropdown menu. Once this data is available, the script will use it to build the chart. I hope these explanations are the reason for the error.
Author of the “Swim Interval Analysis” chart, I created a fork under the name “Swim Session Analyzer”.
This chart provides an interactive visualization of swimming workout data, focusing on intervals, pace, stroke types, and pauses. It automatically detects each interval’s swim style and displays performance metrics such as average pace per 100 meters, stroke count, and distance covered. The chart highlights the fastest interval and allows users to filter the view by stroke type, updating summary statistics and annotations accordingly. Pauses between intervals are visually represented, with detailed tooltips offering insights into stroke efficiency and deviations from average pace.
To use this script, you must first add a custom interval field to your data, ensure it is visible in the data tab, and manually select the swim stroke for each interval using the dropdown menu. The swim strokes must be added in the following order: Breaststroke, Freestyle, Backstroke, Mixed, and Unspecified. Once this information is provided in the specified sequence, the script will automatically incorporate it to generate the chart and display the relevant performance metrics.
This ensures that swim stroke data is consistently organized and interpreted by the script, providing accurate filtering and visualization for each stroke type.