I love how configurable the fitness chart is. I currently have mine set up as follows, but am interested to see what data others like to show, and how it adds value to you.
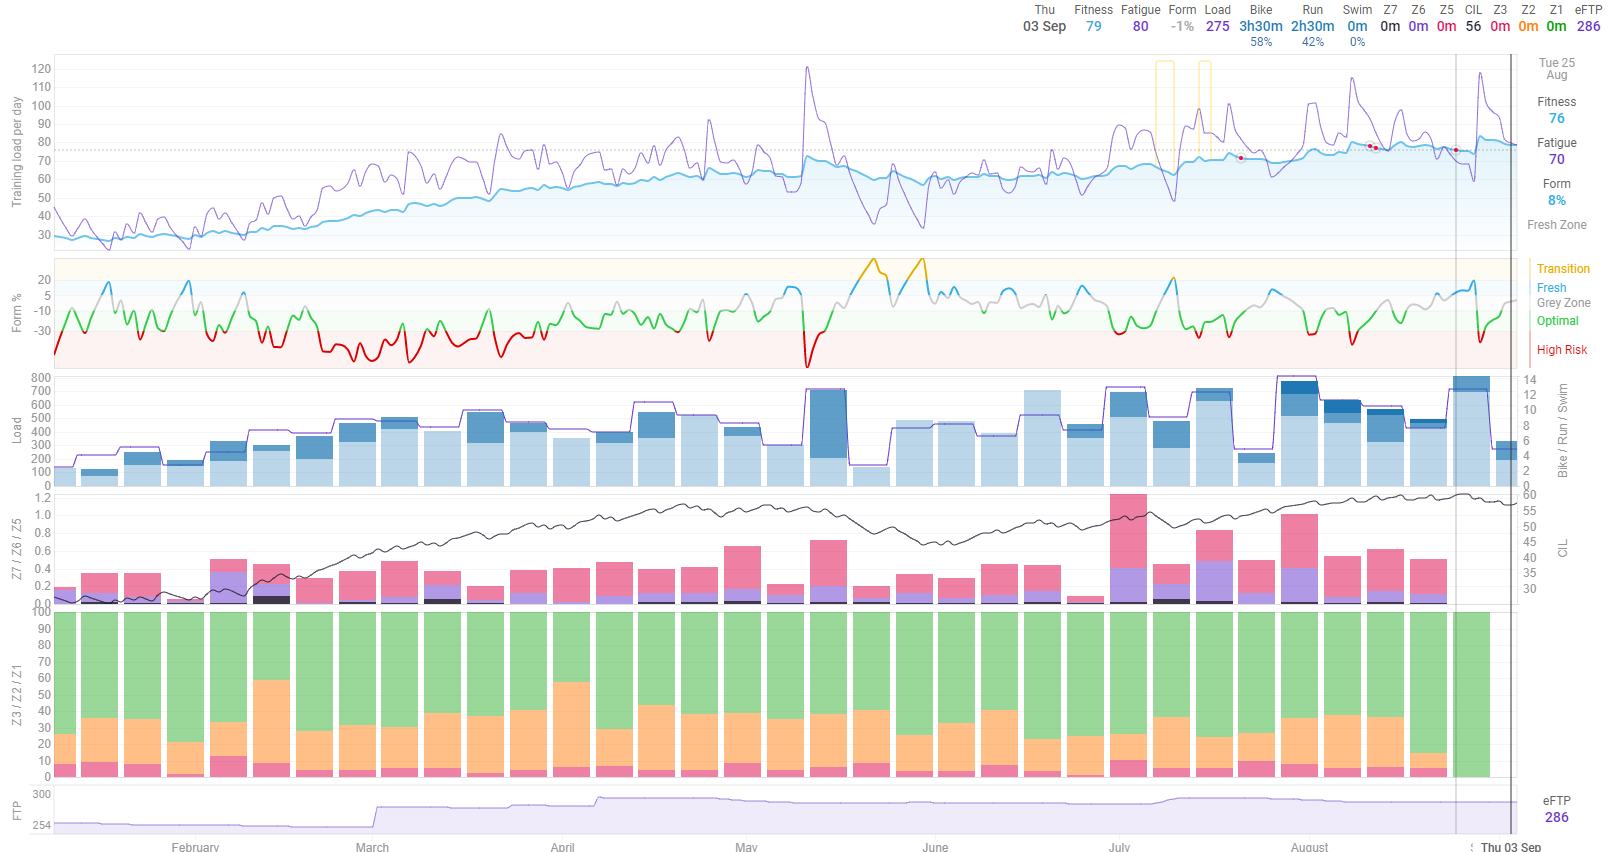
- The load chart shows weekly hours versus the line which shows load
- The intensity chart shows time above threshold and chronic intensity as a moving average
- The polarisation chart shows time in zones in a 3 zone model
5 Likes
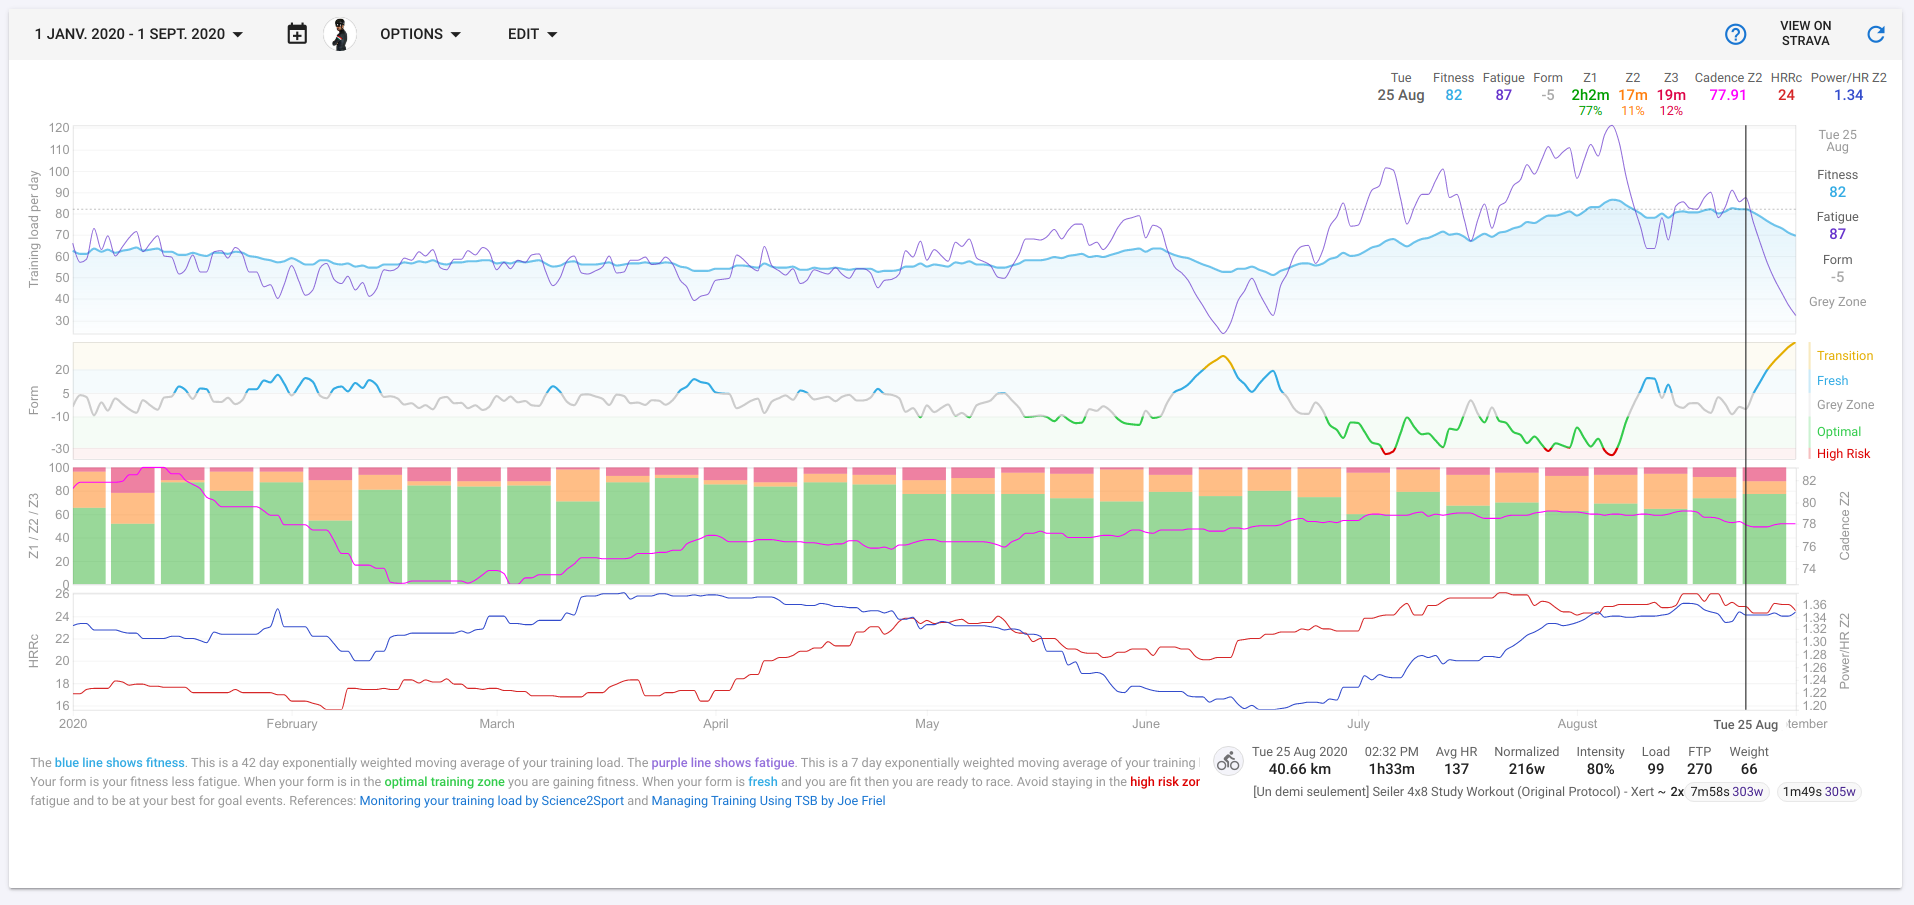
I like to see my Z2 cadence (though I don’t know yet what to do about it :-P), and the evolution of my HRRc (to check the level of fatigue) as well as the ratio Power/HR Z2 to see if I do improve my base.
3 Likes
that’s a tidy chart, this shows you understand your training and why certain bits of data are key to you understanding how you are doing in your training.
As a coach I turn certain features/charts on or off to determine how athletes are measuring up in certain phases. You can imagine what you track in KJ/W is more important during speed and peaking phase than in base period where Z2 power/cadence is more important to track with force.
1 Like
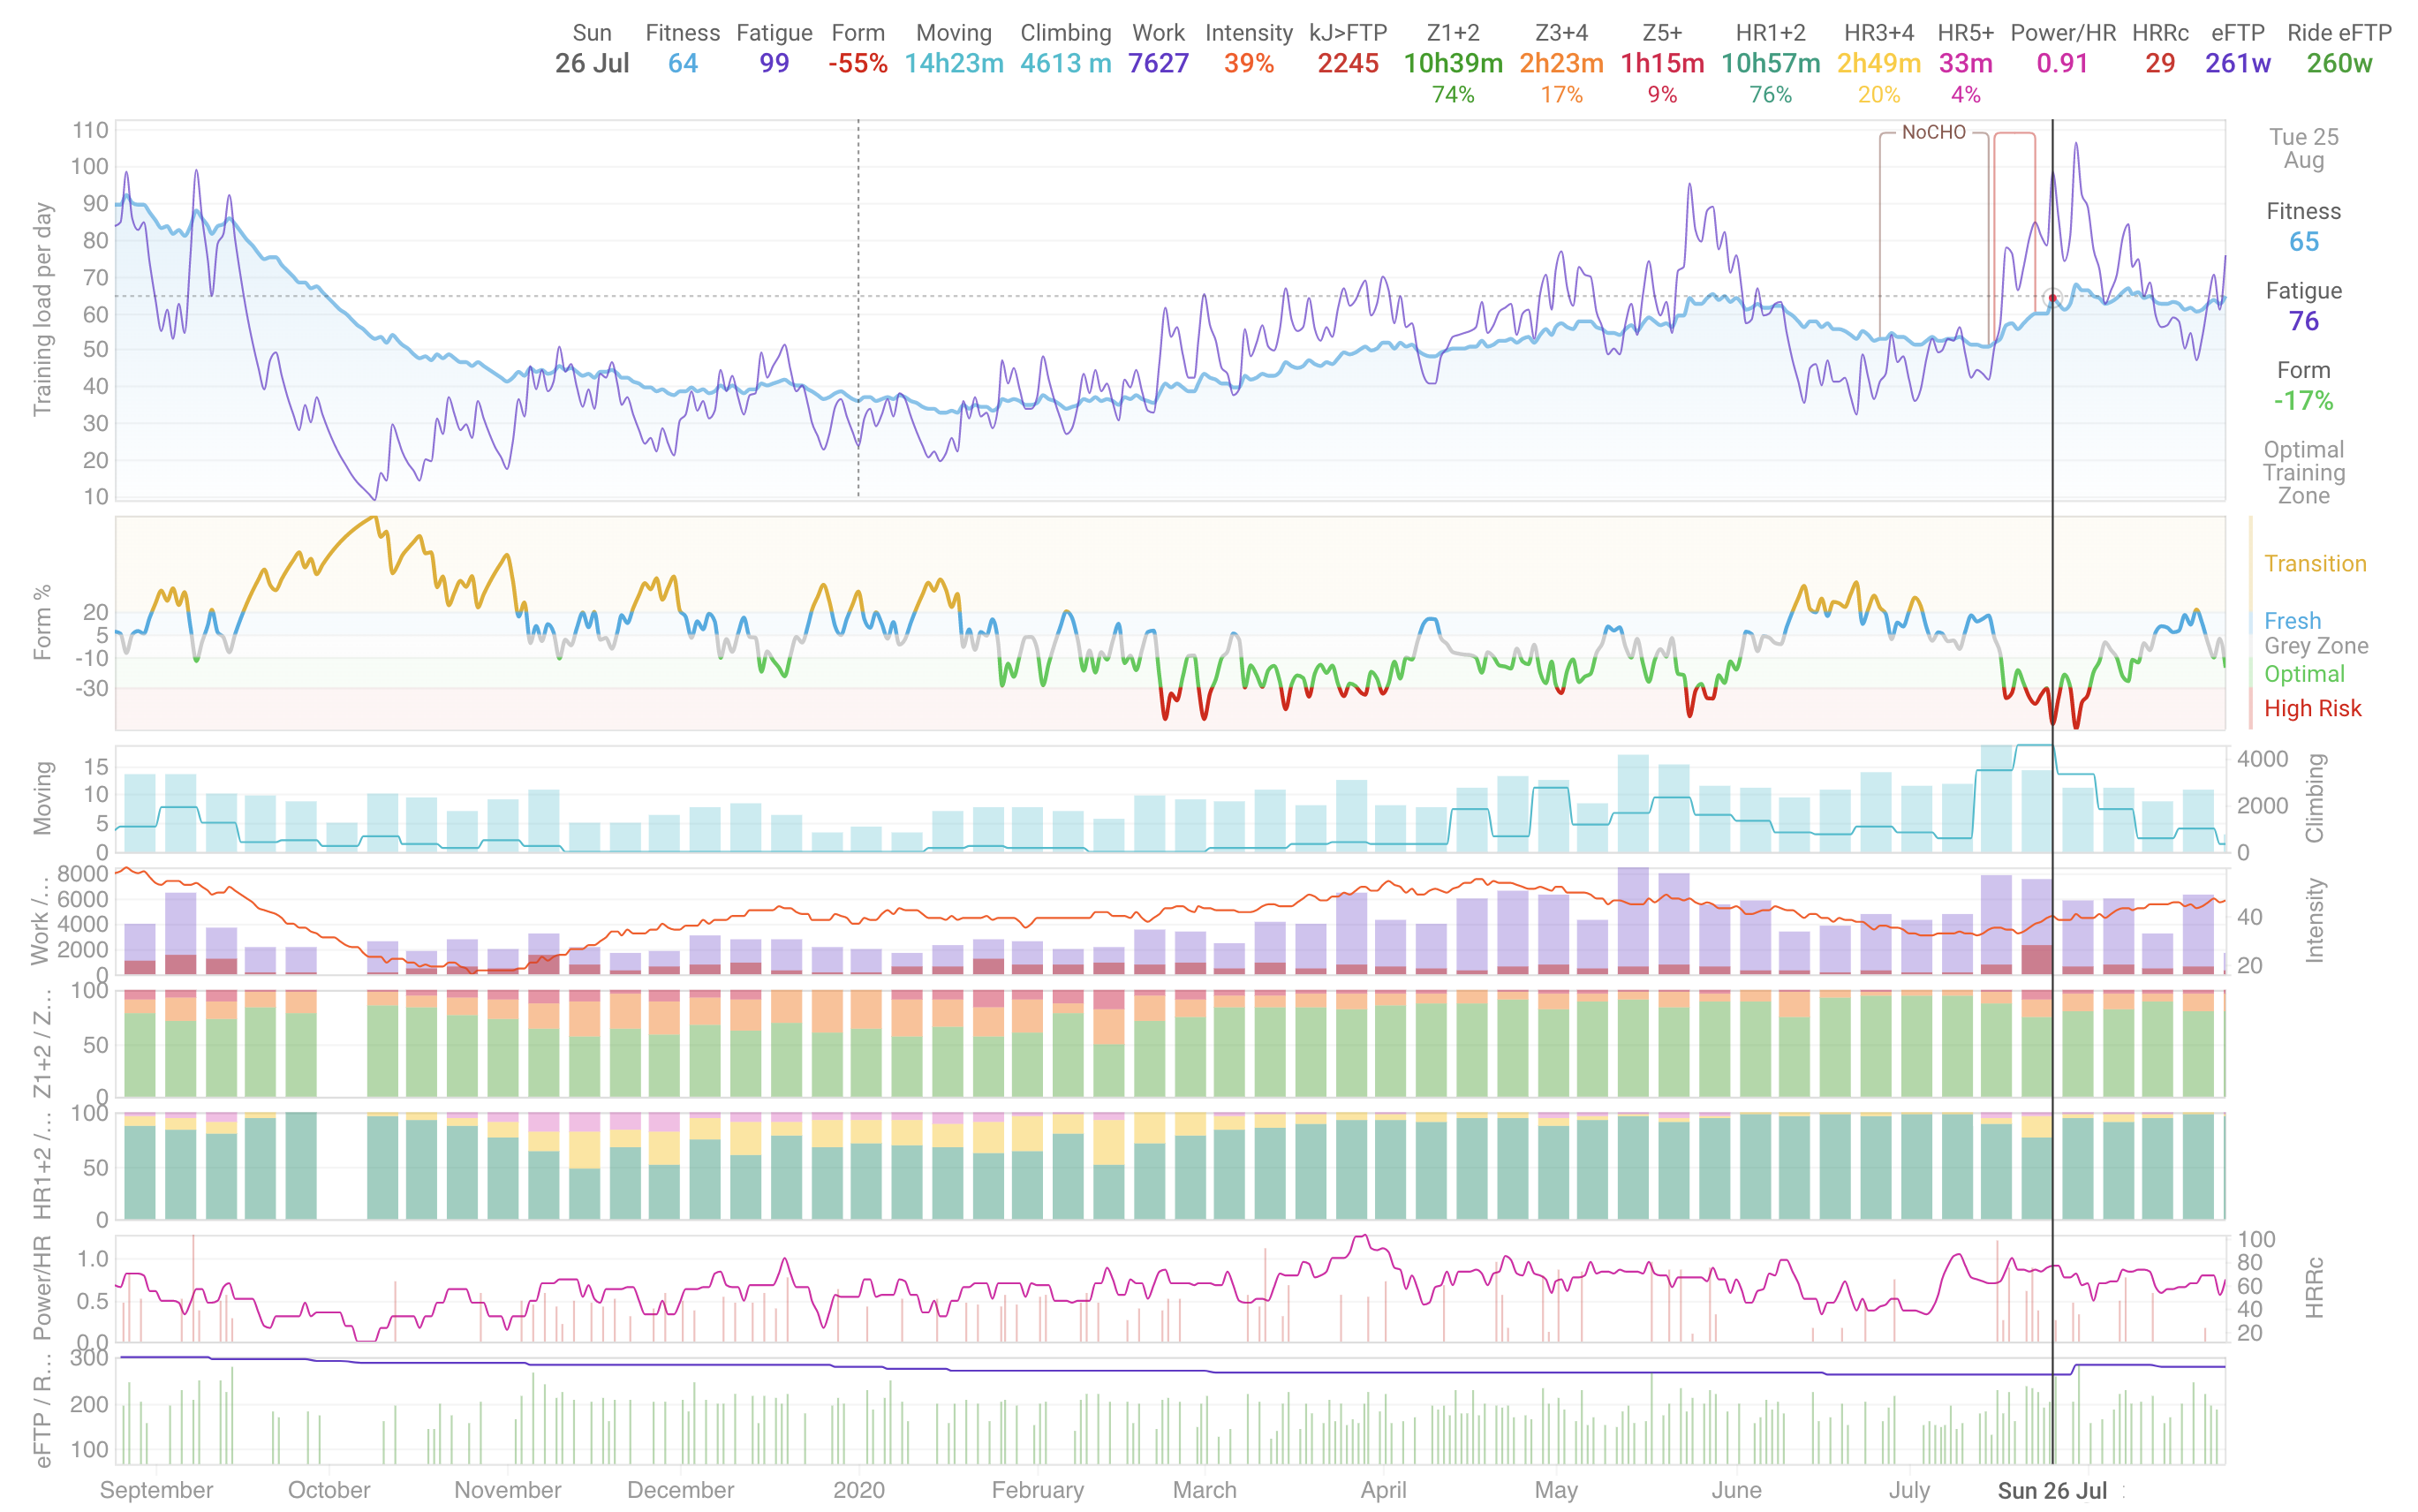
And here’s mine…
I had cataract surgery 2 weeks ago, which shows nicely in the charts 
2 Likes
You should train more 
What value do you get from each chart? Very interested as your chart suggests a perfectly managed ramp rate and great consistency, but hardly any obvious recovery periods. Its almost like build-build-build-maintain…
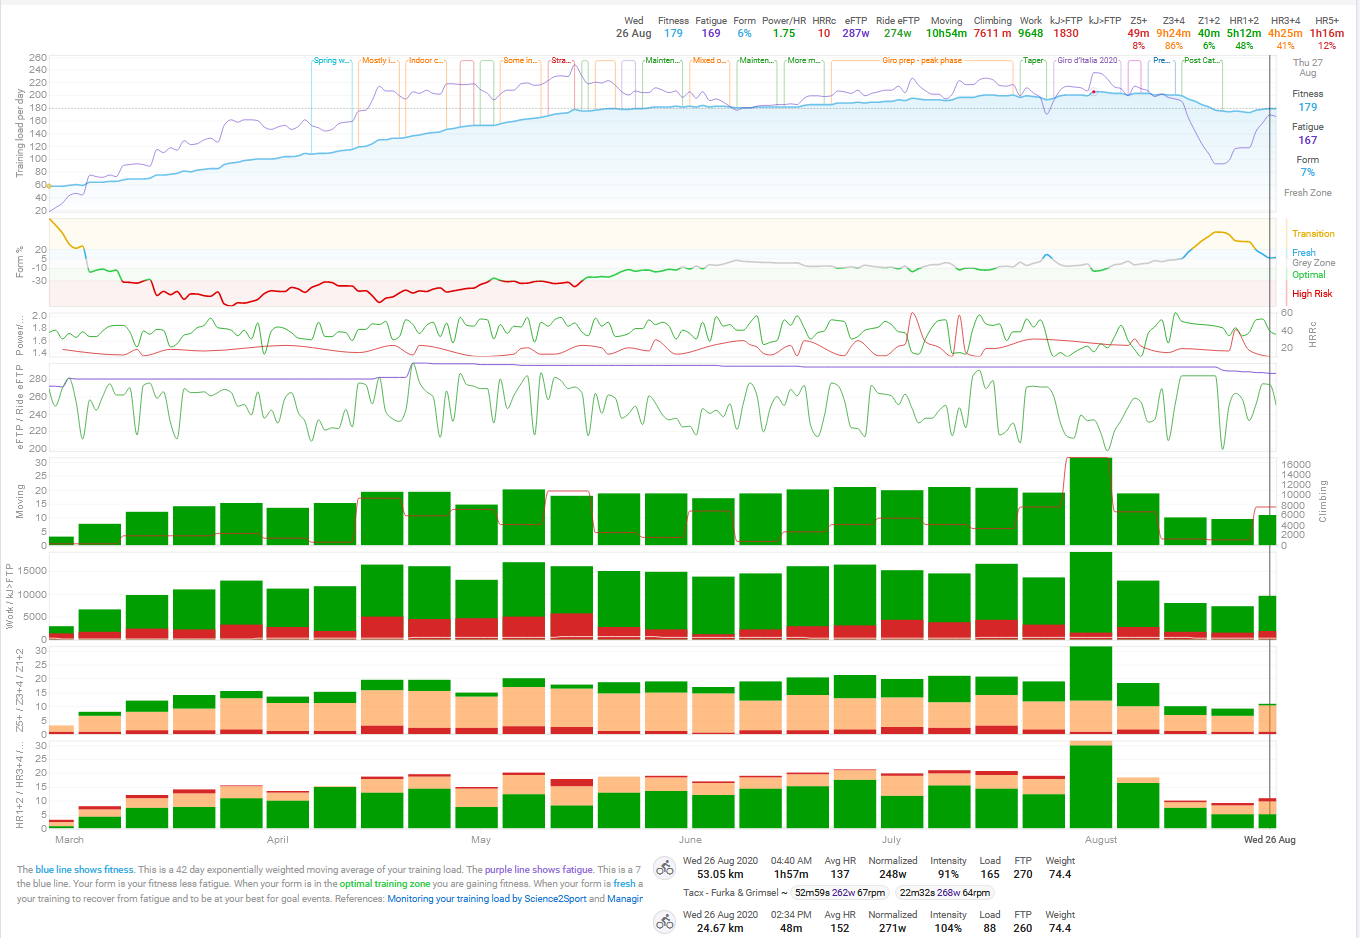
I actually mostly look at Form and zones. My TL is high, but that’s because the only way I could prep for my Giro adventure - high altitude, climbing - was by putting in volume at SS as much as possible.
Now that that’s behind me, a high TL is not a target, but I’m there anyway and still going, so yes, it’s maintenance. Being used to the volume, I don’t really need the rest, but I will take it down a notch one or two rides a week.
Also, by looking at the numbers more often, I try to avoid mistakes I’ve made, burning myself up - it probably doesn’t look that way, but this year (it) is actually going well.
I did have two cataract surgeries, sadly 6 months apart b/c of Covid-19 - that’s the other dip at the start of the 6 months on display here, so that (forced breaks) may have helped in that regard as well…
How do you put the periods on the CTL curve? For example, Giro de Intalia, taper, mainten…thanks
Is there a way to export your chart settings?
How did you manage to stack bars with the elapsed time (hours per week)?
Charts can be shared. Click on the pencil next to the chart name in Options and then on Share top right.
You can find shared charts with the chart lookup glass, again in Options.
I don’t think you can share/export a complete fitness page in one go.