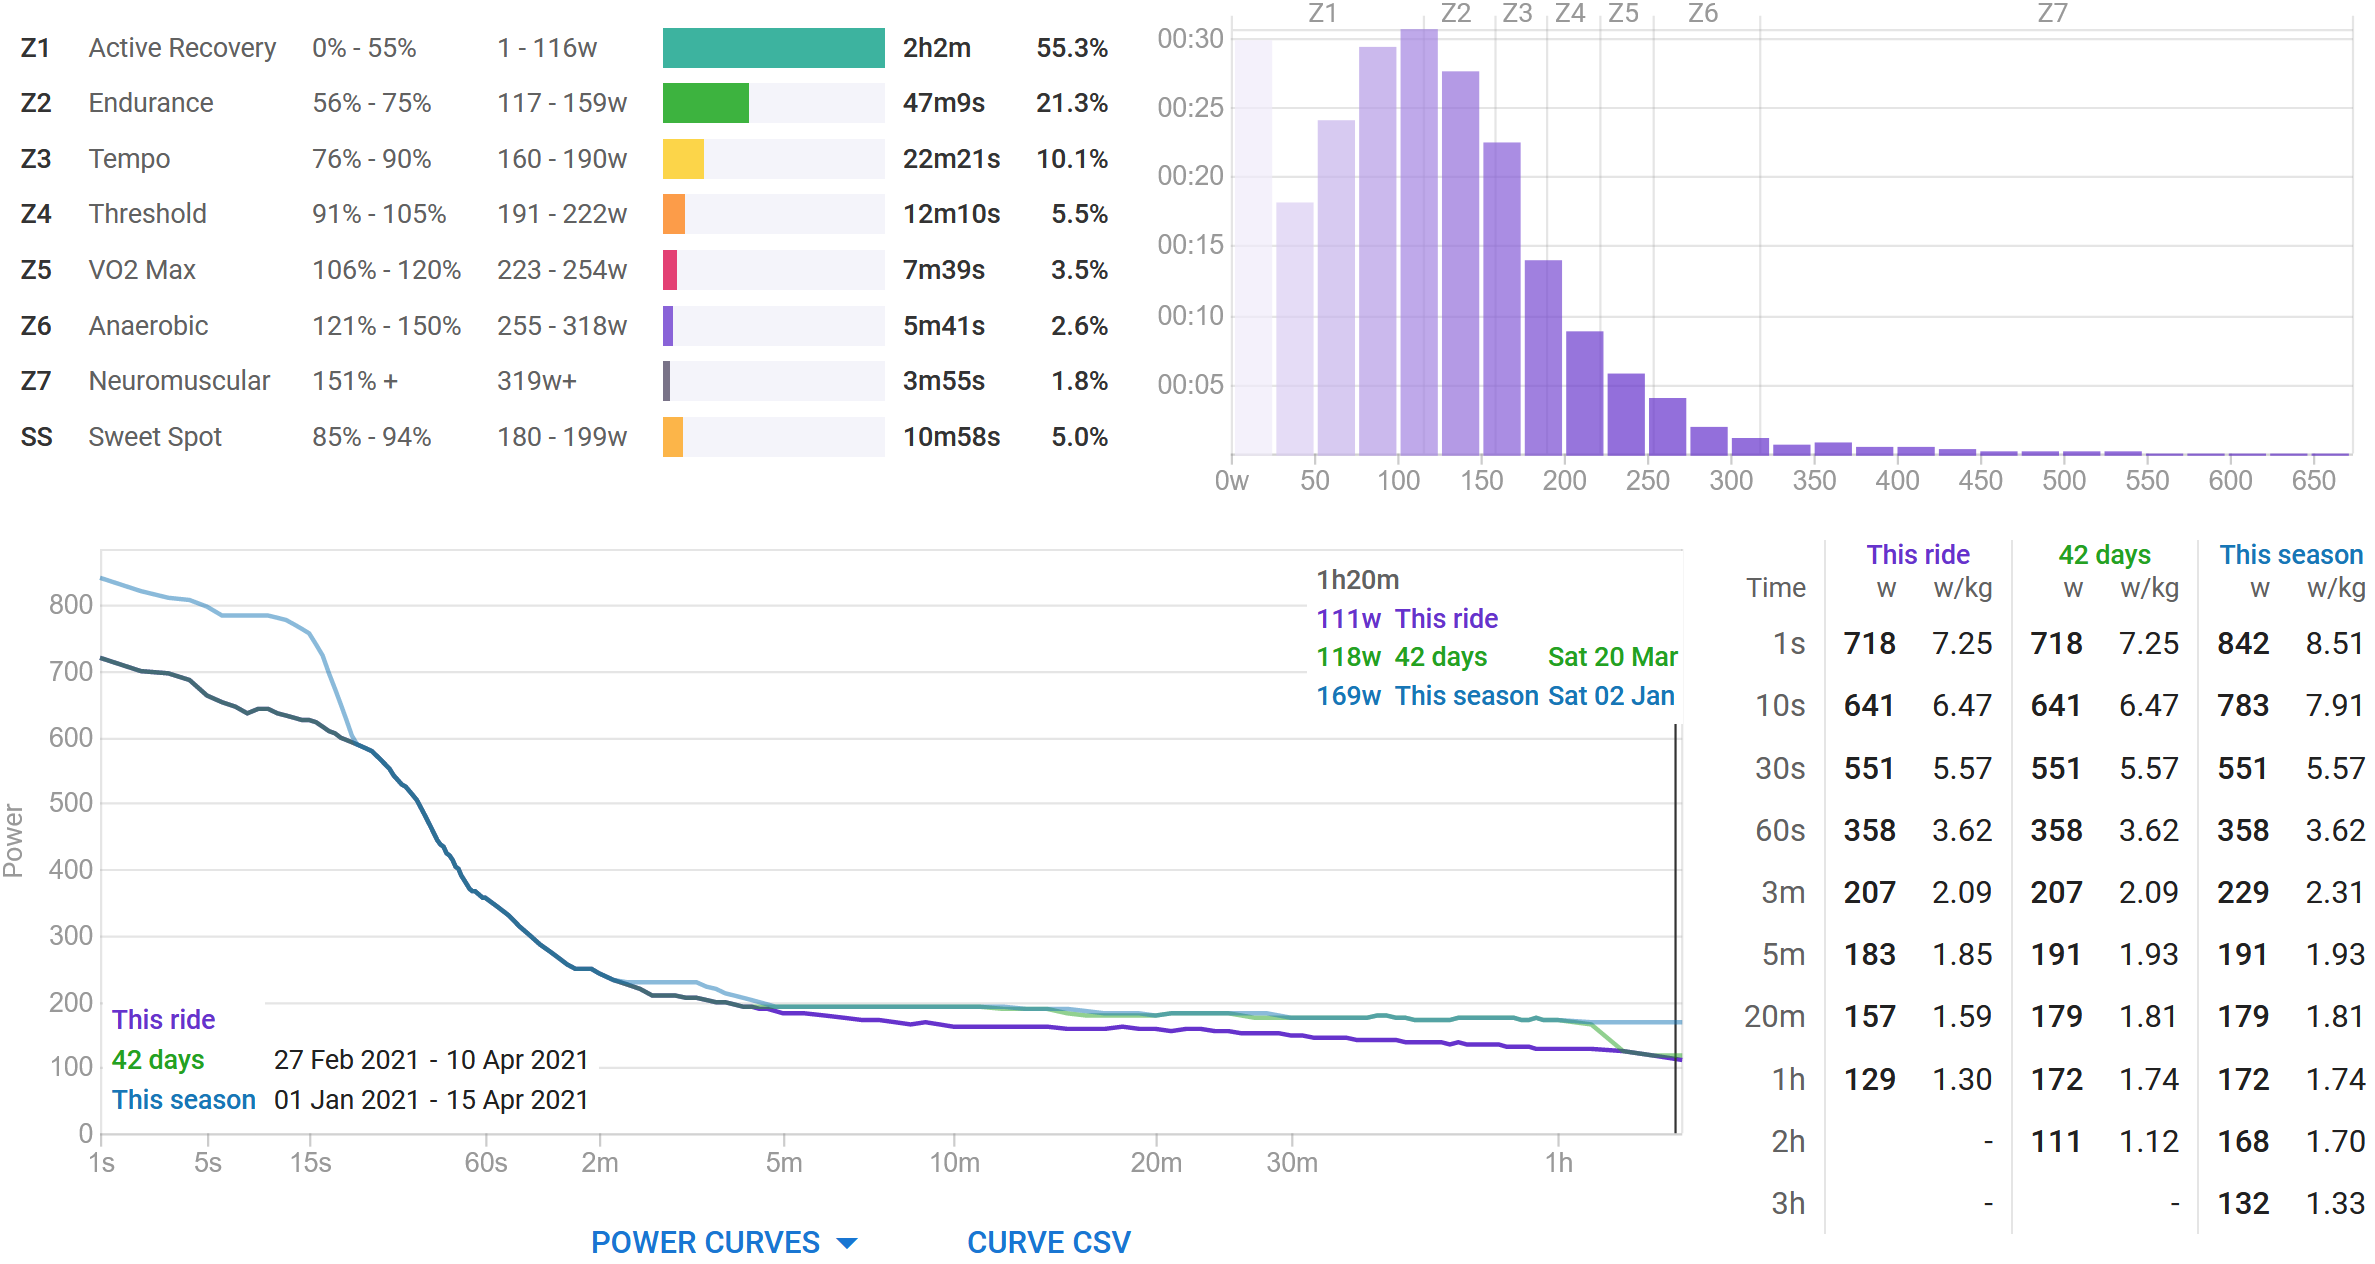
On this ride from April 10, the ride was 3:42 (actual ride, not including additional time for rest stops) but the power curve shows less than 90 minutes. And this ride doesn’t appear at all in the “best efforts” table on the right for three-plus-hour rides (it would be the only one in the last 42 days).
Can someone help me figure out why this is happening and how to fix it? As you can see by the time-in-power-zones table at top left, there IS power data for the whole ride in the file.
Intervals.icu calculates the longest part of the ride without rest stops and only calculates and displays the power duration curve up until that point. This is so to include only actual riding time on the curve, not rest stops. Otherwise you end up with a long, not very meaningful (because of the stops) tail on the chart.
OK, I understand your thinking there (though I disagree with the approach)… but I’m not sure what changed. All my rides over two hours have always had rest stops and Intervals.icu has always shown me the power curve for the whole ride.
That 132W ride of three-plus hours last season in the screenshot above, for example, was certainly NOT a continuous ride… I am simply not physically capable of that yet. This is the very first time I’ve had a ride that did not show the power curve for the whole ride.
Why did it “work” before (give me power-curve data for the entire ride) but not now?
IMHO it would be ideal to show the true power curve for the whole ride, including the pauses. In this case, my ride would have actually been about 4.8 hours instead of 3.7, and every minute of rest would reduce the average power due to the time spent at zero power.
To me, the fact that I can produce X real, average watts of power over 4.8 hours and 91km is the most important metric. Then I can work on developing more power, or resting less, and I’ll be able to see the improvement.
I don’t see any way in which the current presentation is superior.
Is it a single 10 minute long stop, or is it cumulative?
Im currently experiencing this same thing, but I don’t ever remember this happening in the past AND it is happening on rides where there is not a 10 minute long single stop.
Is there a way to show the power curve for the entire ride and not have intervals cut it short? Also, why is intervals cutting it short when my Garmin computer is paused/stopped during the stop? Garmin doesn’t cut the power curve short, so why is intervals?
I mostly agree with this. And @Tyler_Hawkins you should not Pause/Stop your Garmin during shorter stops. Not counting in Stops, screws up W’ calculation. Golden Cheetah automatically detects (Time Gap detected) this and adds zero lines for the duration of the stops while W’ recovers.
For stops longer then about 30 min, you’re better off starting a new activity. For that duration, W’ has completely recovered. And this avoids false speed/distance curves caused by inaccurate GPS signals while stationary.
I have all automatic start/stop/pause functions disabled on my Garmin and stop/save my activity when taking a longer break.
Haven’t experienced myself what is mentioned here but since Covid, I haven’t done any organized rides with food/drinks replenishment. So I just keep riding while eating/drinking what I brought.
To be honest, I don’t really know how intervals treats this situation.
It shouldn’t happen unless there is a single stop 10m+. I see this one (https://intervals.icu/activities/5385706862 only goes out to 3h but doesn’t appear to have any long stops. I will have a look.
However I think I will have to review this behaviour as it generates a lot of confusion. I do need to have some duration on the stop time. Sometimes people forget to start a new activity and have stops > 24h. What about 30 mins for a stop? Surely if it is that long you don’t want the power curve to span that?
Actually that activity I referenced does have a 10m+ recording gap at 2h54 until 3h12. Anyway I have changed the “stop” threshold to 30mins so now you get the whole 5h power curve for that ride. You can click “Actions” and “Re-analyse” to fix others.