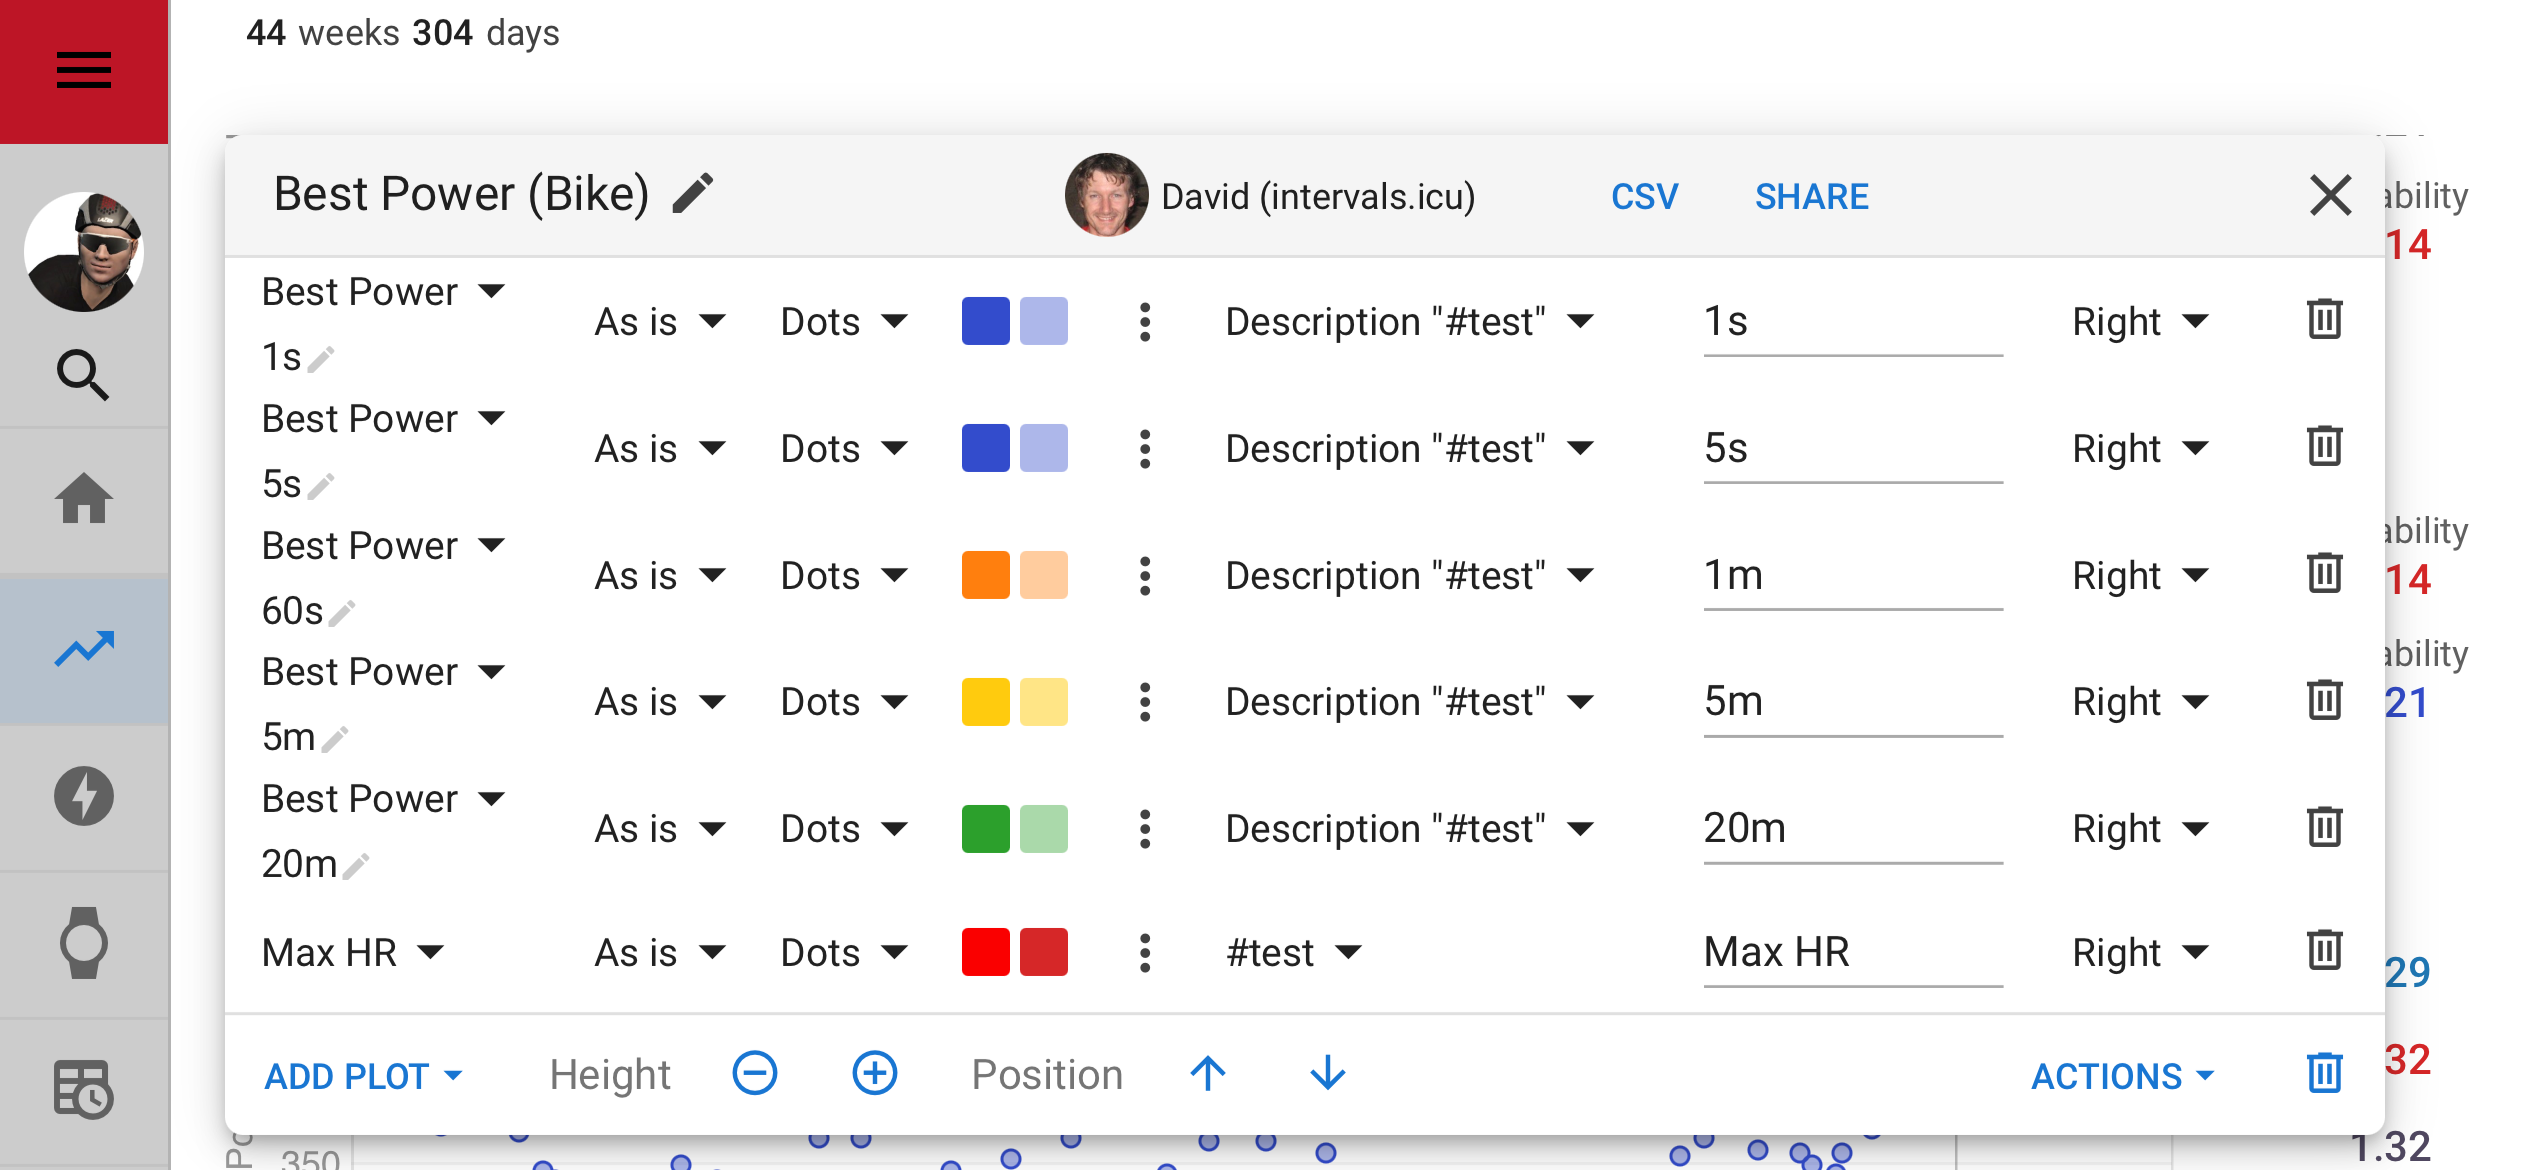
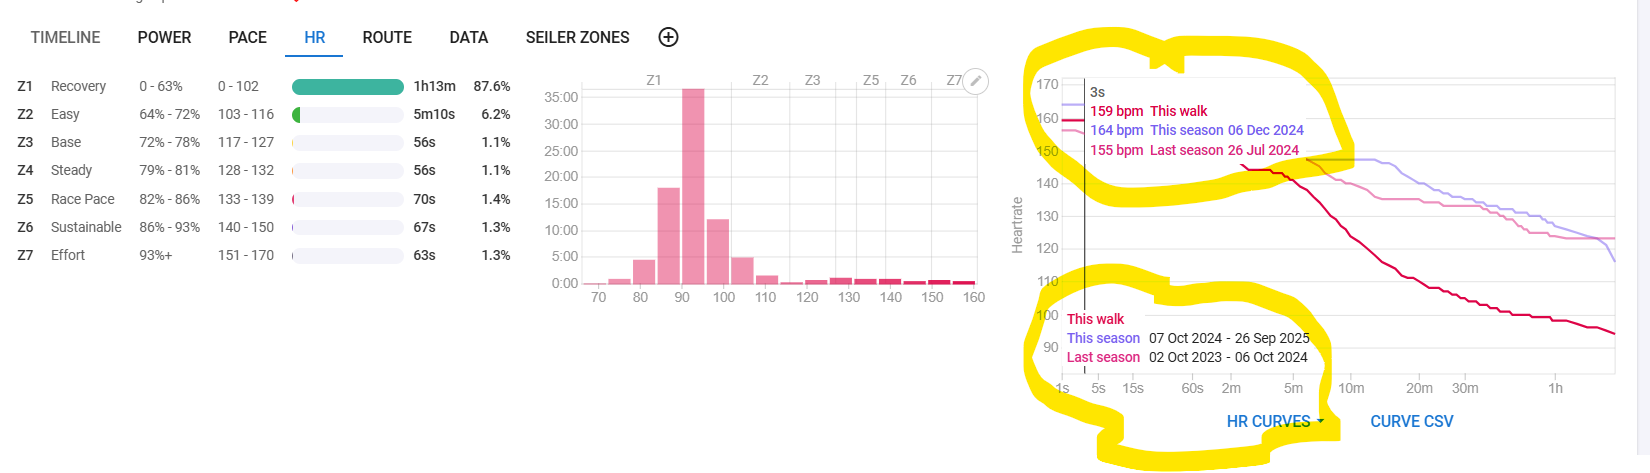
I’m looking for a way to view my maximum heart rate over different time durations — specifically for 5 seconds, 1 minute, 5 minutes, 20 minutes, and 1 hour. Ideally, I’d like a custom graph that shows this, similar to how the power duration curve works for best efforts.
So far, I haven’t been able to build a graph that allows me to track max heart rate for these time frames. I’ve checked the available dashboards and chart options, but I must be missing something — I can’t seem to find this functionality anywhere.
Has anyone here managed to create something like this or know if this feature is available somewhere in Intervals.icu?
Any help or pointers would be greatly appreciated!
You’re looking for HR above a certain value for each duration. MaxHR is the max HR for the activity, so it would only show 1 value per activity. I’m not at my computer, and don’t like using my phone for charting. Will have a look sometime over the weekend.