Shouldn‘t these HR/power against time period graphs/data be monotonically decreasing with increasing duration of the period??? I.e., anything I achieved/did for 7 min I also did for 5;-)
Was is a steady ride or intervals? can you show the power graph or hr of that ride?
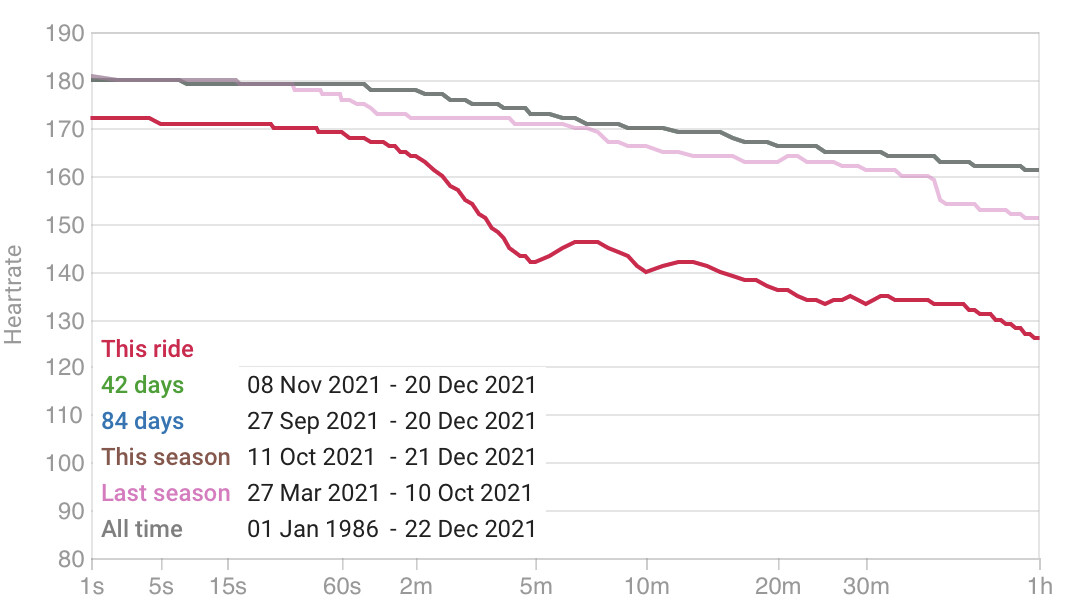
If you rode 2x3min@168hr os something similar with 3min@120hr of rest then the graph is ok i think.
/7min hr is higher because its overlapping second interval and you hr is rising again
Important thing to notice: graph is showing continuous time in corresponding hr, not cumulative hr time from the whole ride.
Hey @Lukasz_Pludowski , you got this right, thanks for pointing it out clearly to me!
Yes, this ride were 2 min Vo2mx/MAP intervals with 3 min rest, and that’s why there are maxima at 7 min = 2 + 3 + 2 min and at 12 min = 2 + 3 + 2 + 3 + 2 min. Realized a bit more again in my power-based training…