Hola buenas tardes, tras ver unos graficos y una serie de analisis muy interesantes de @Luisma_Gallego_Soy_P , me parece muy interesante para conocer la carga interna dentro del trabajo saber si se podria habilitar la metrica rr/a1 que se graba en el FIT de garmin??? Esto seria de gran ayuda para nosotros.
Muchas gracias
Alguien ha podido evaluar esta opcion?? Es muy interesante para todos
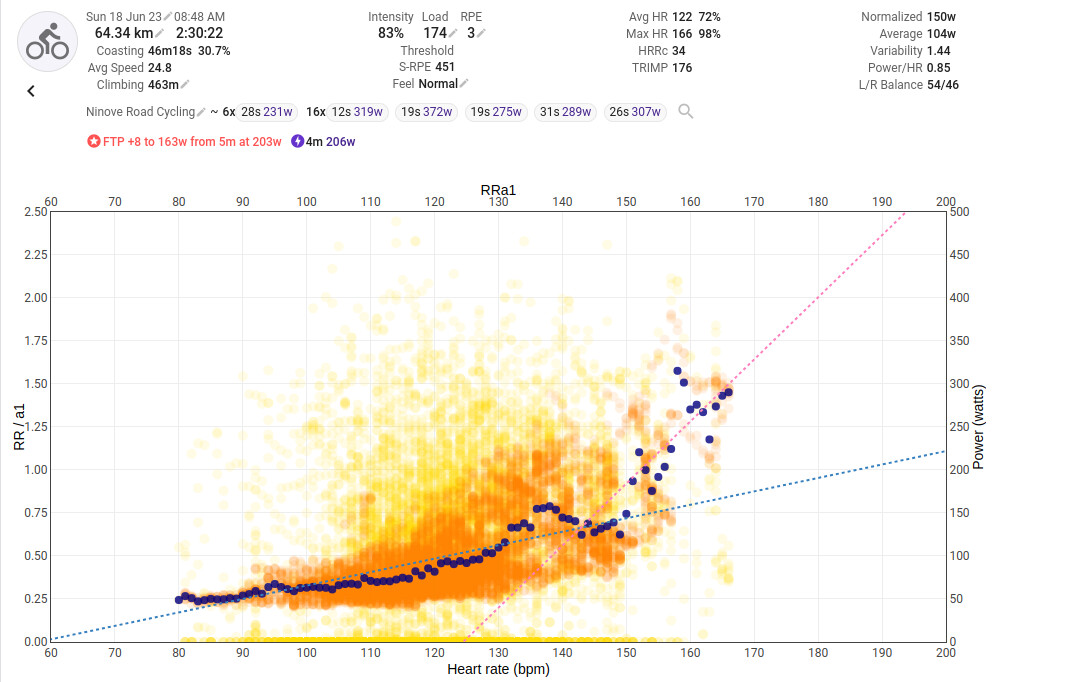
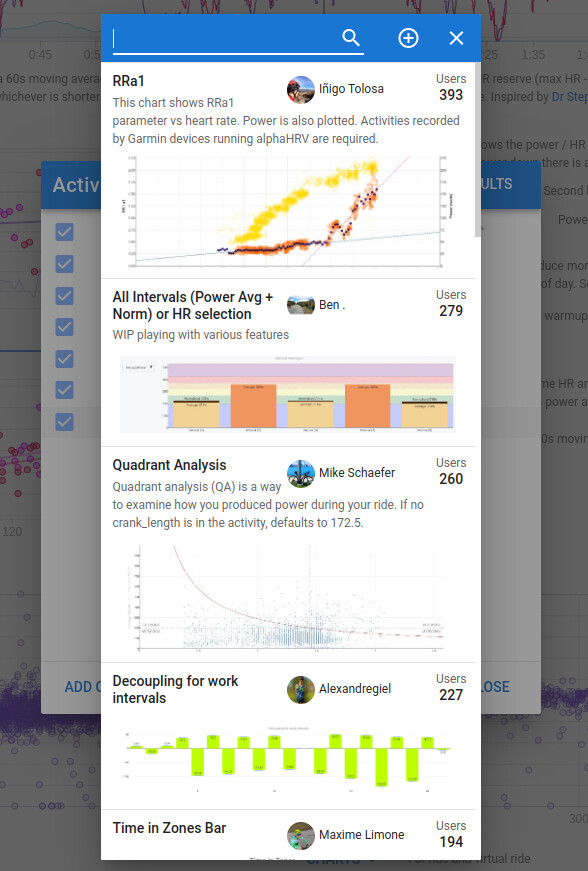
Go to the bottom of the Activity Power page and click on charts - looking glass and add inigo’s rra1 chart to get this:
BTW @Inigo_Tolosa : for long rides, there is a memory problem. Not sure what the threhold is but I have 2 rides over 8 hours where the error comes up.
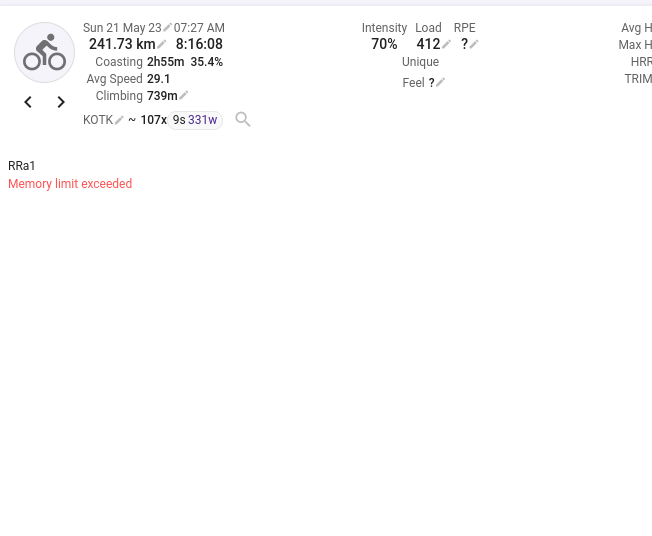
Thanks for this warning. I haven’t reached so long rides this year yet 
I don’t know what memory limit applies. Maybe @david can clarify this point.
Anyway I will try to improve memory usage and release a new version for this chart
I have doubled the memory and CPU limits for custom activity charts. Hopefully that is enough but let me know if it isn’t.
1 Like
Solucionado
Gracias
Algun apartado donde poder enterder mejor esta grafica???
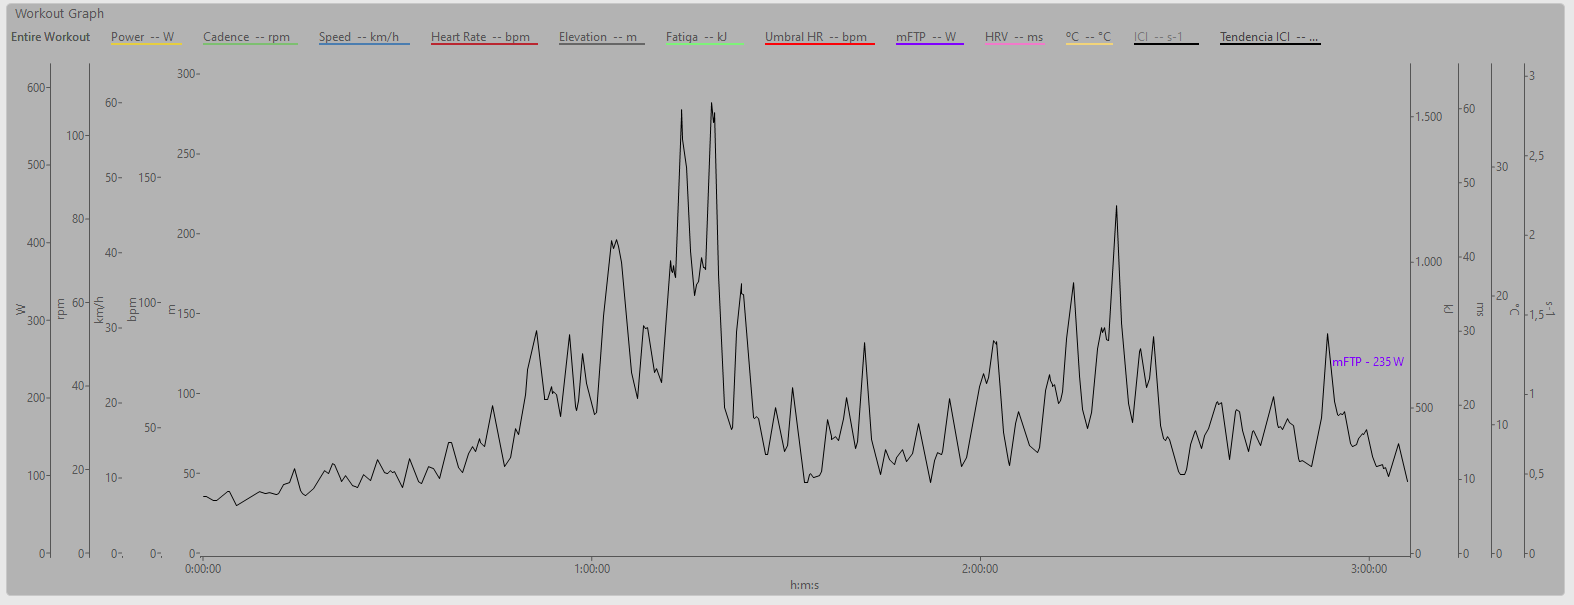
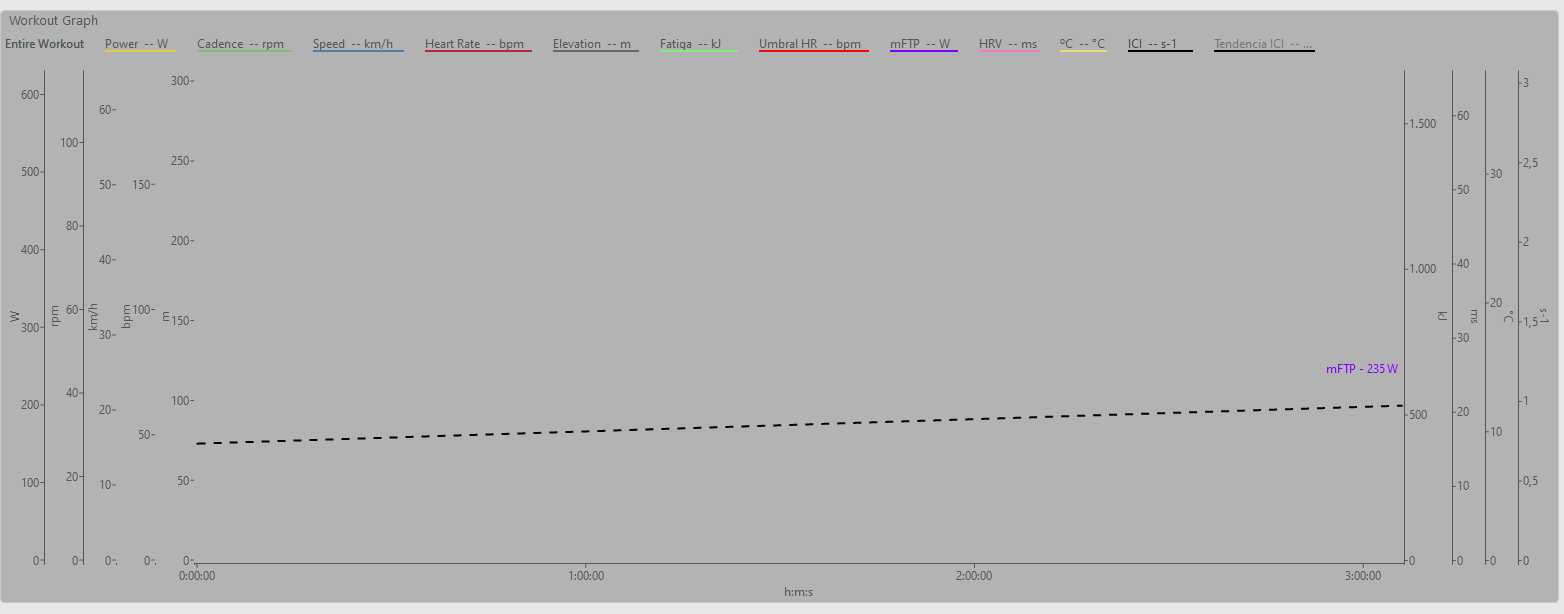
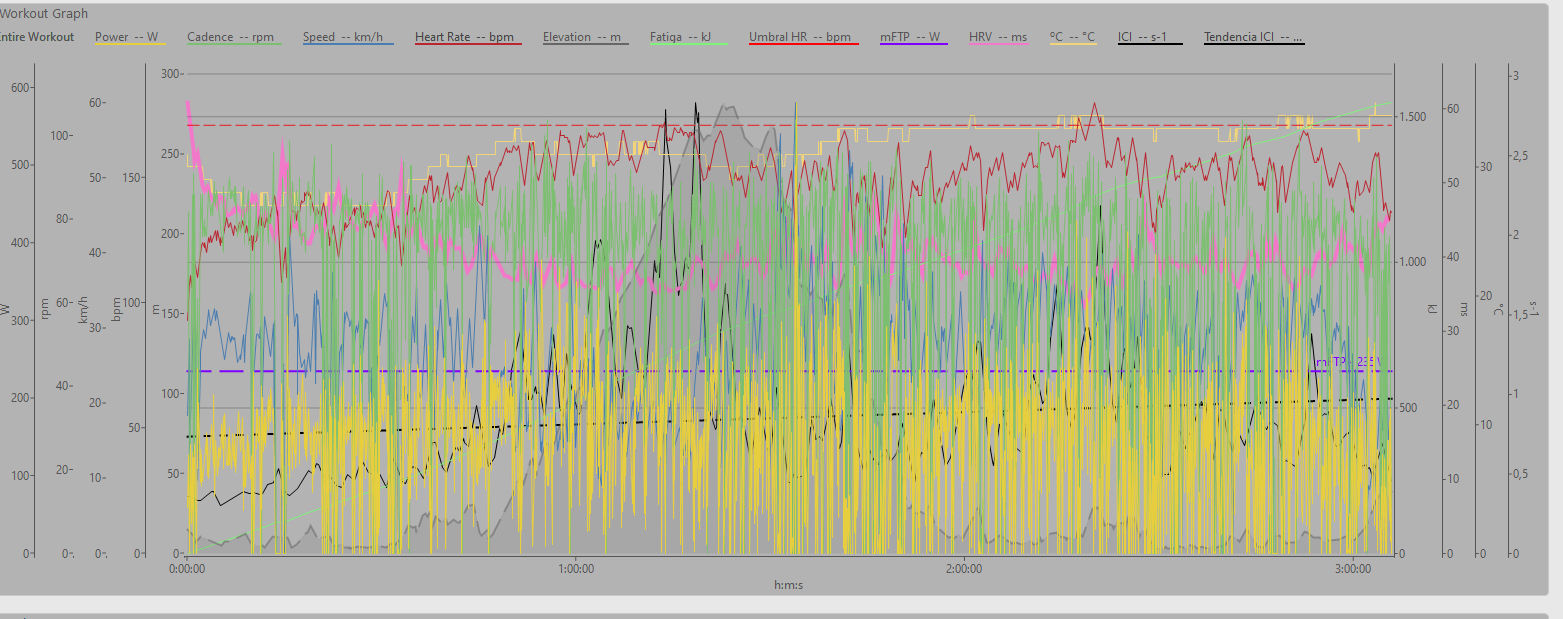
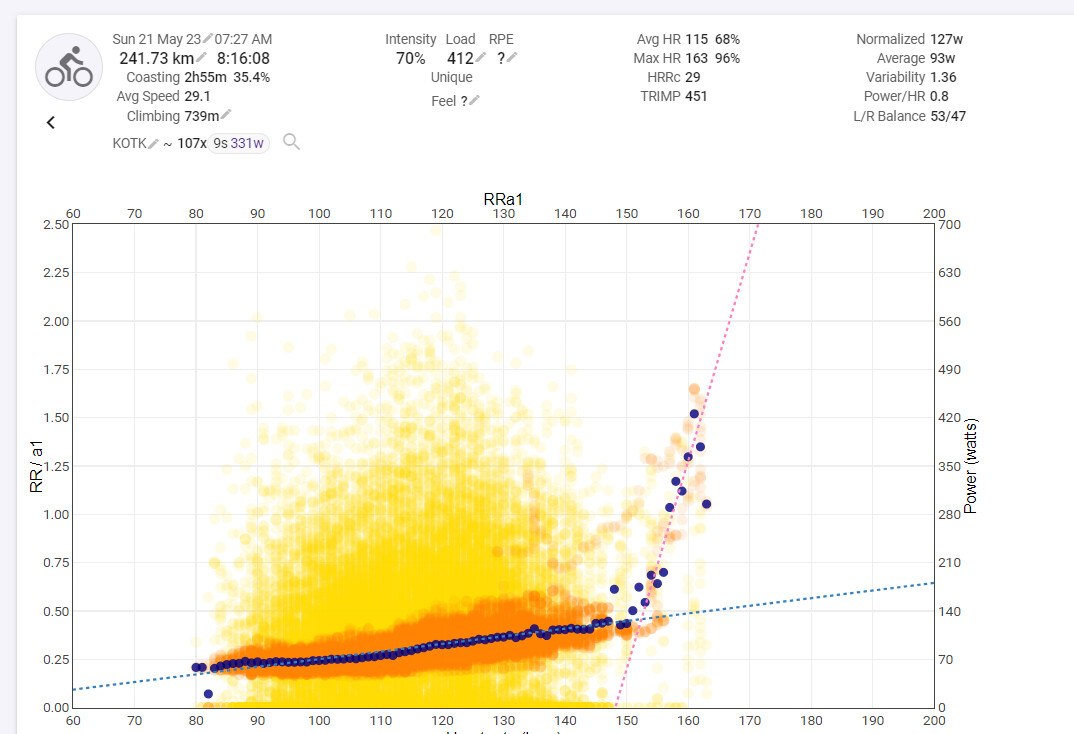
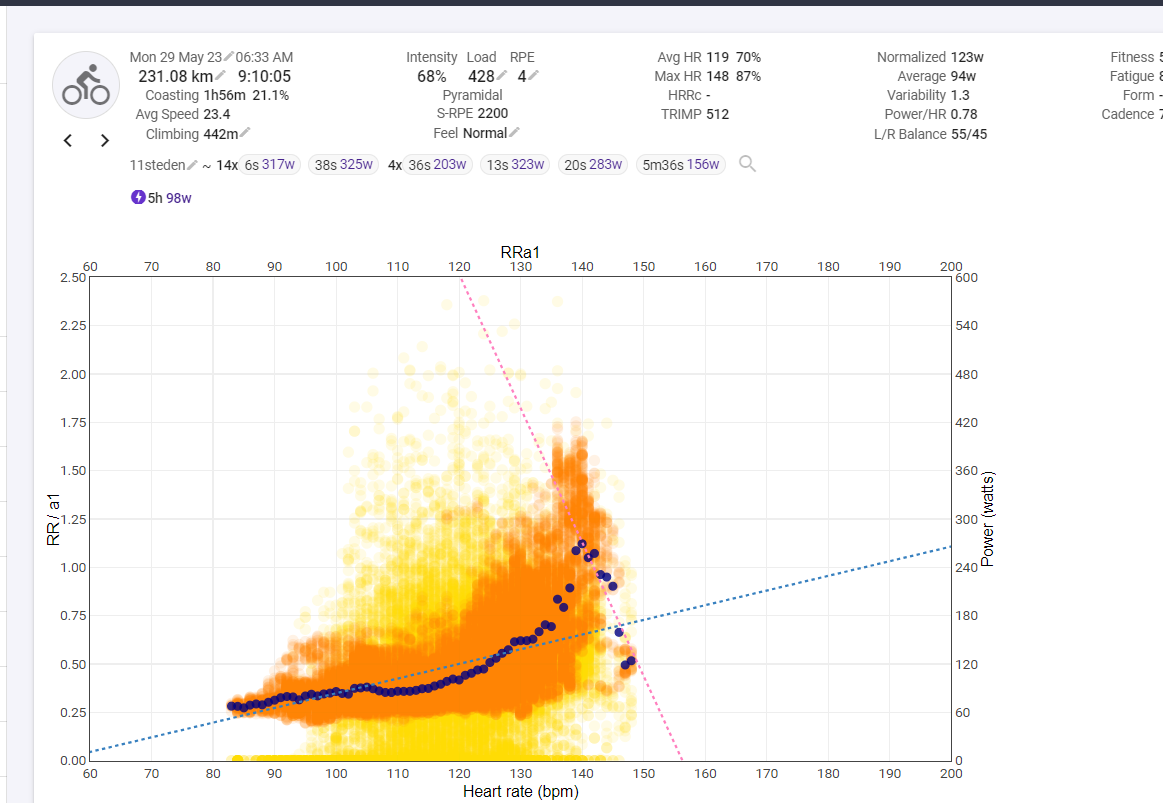
In the beginning, that chart is not the one that is being looked for, the issue of rr/a1 and according to the many tests that I am doing and we are investigating with an interesting number of athletes, it is an indicator of internal load, where we can see exactly where the session is being more problematic, then we can separate that rr/a1 and see at what level it has caused more problems, what is sought is to be able to graph it throughout the activity as if it were a watt chart and then be able to observe the trend. Depending on, for example, the slope of the curve, we can draw conclusions. I have cases of athletes who have reported bad feelings at the beginning and with the passage of hours they have gone much better and that the trend of rr/a1 has also corroborated it.