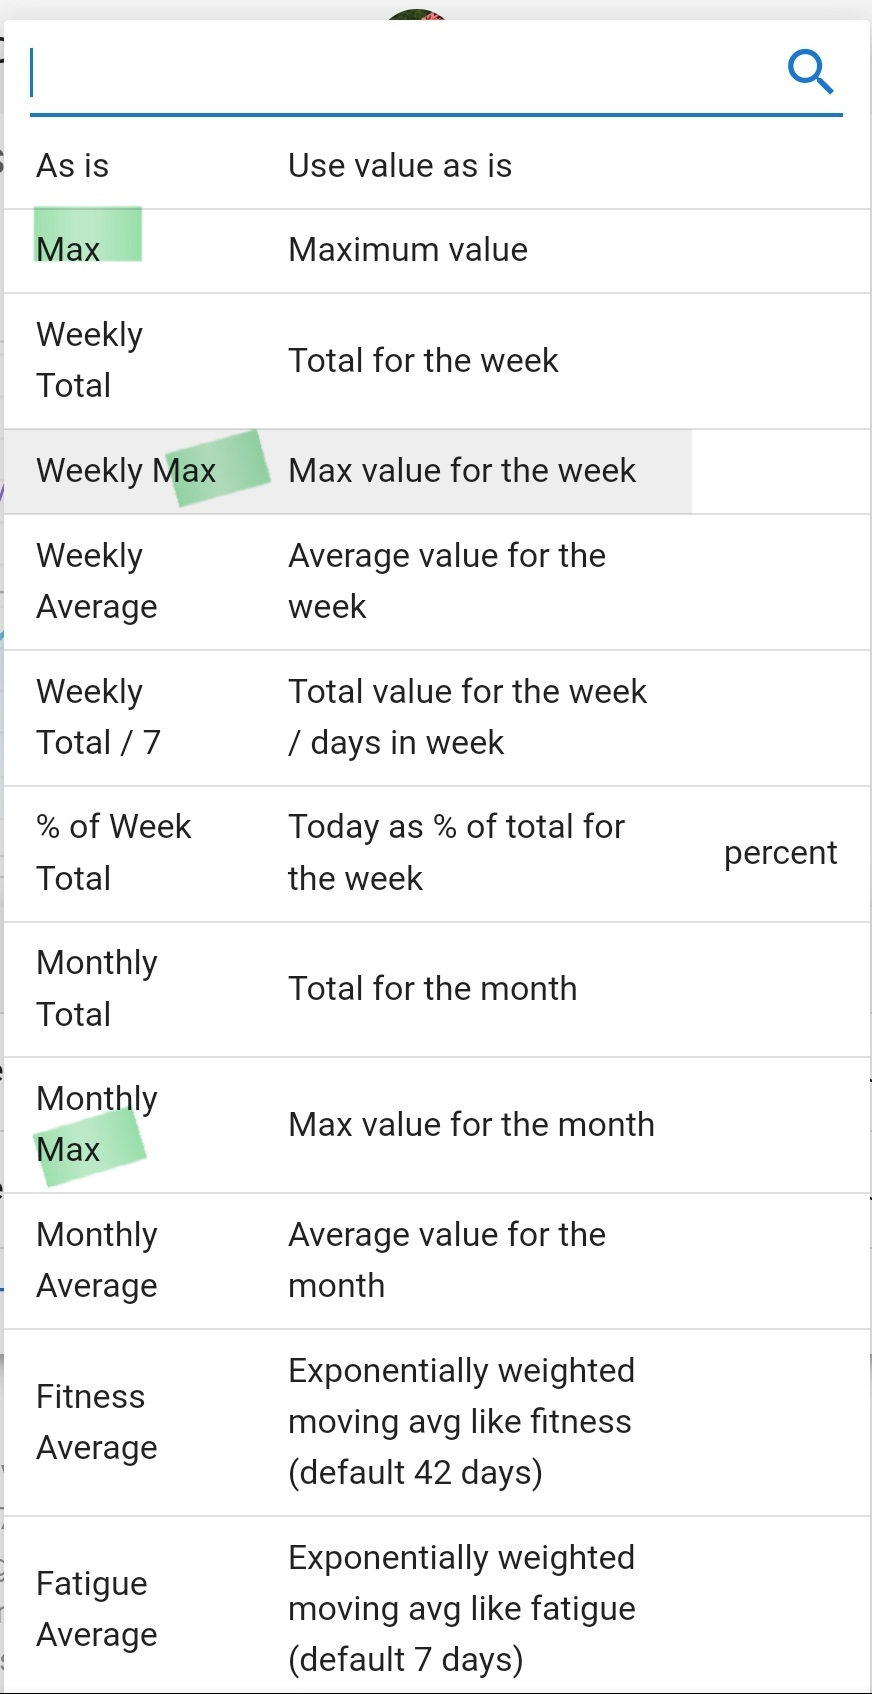
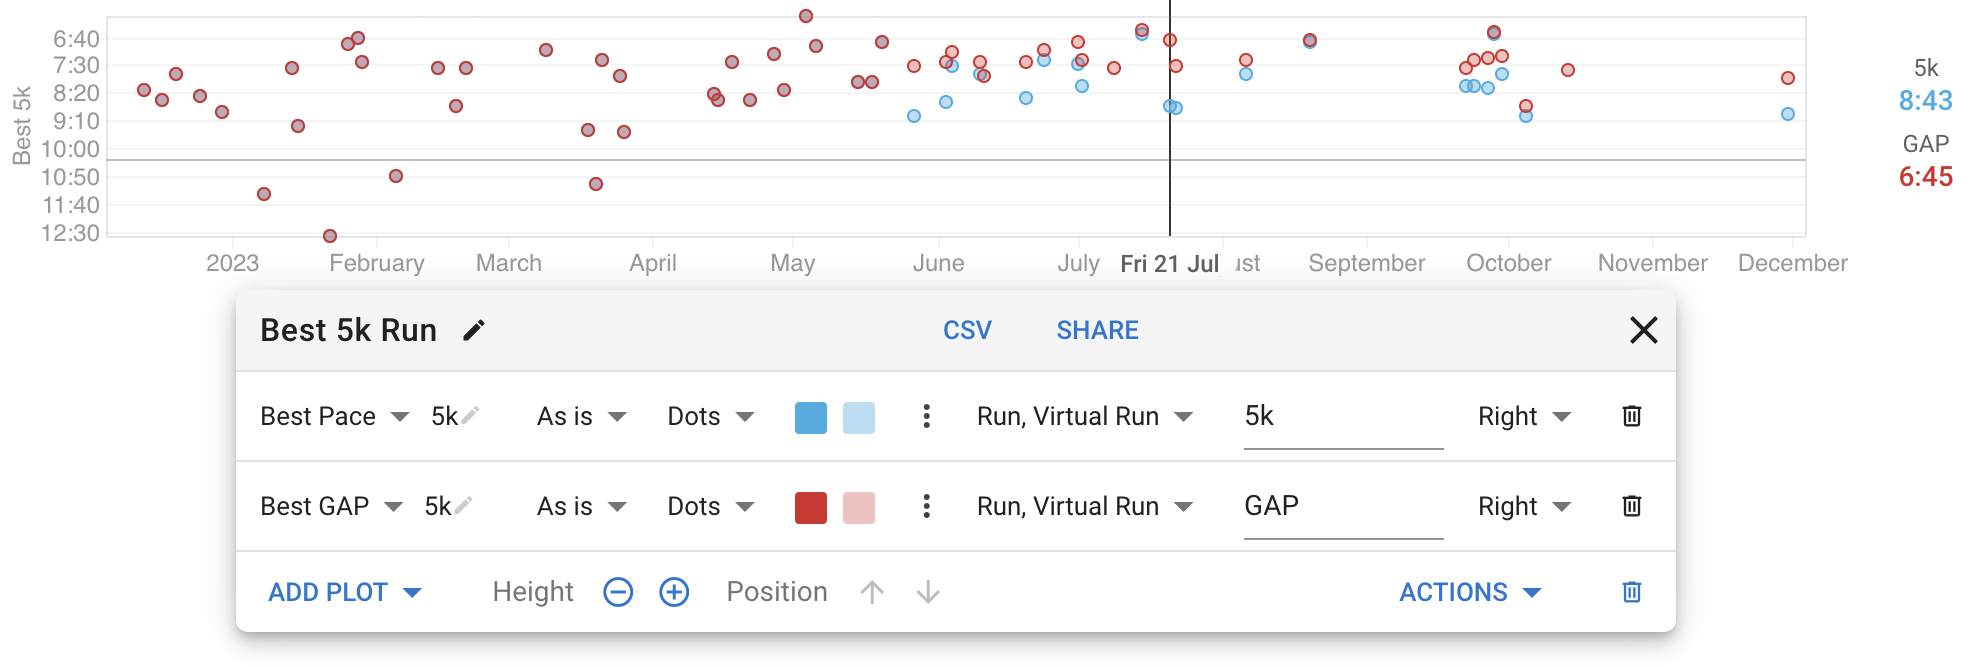
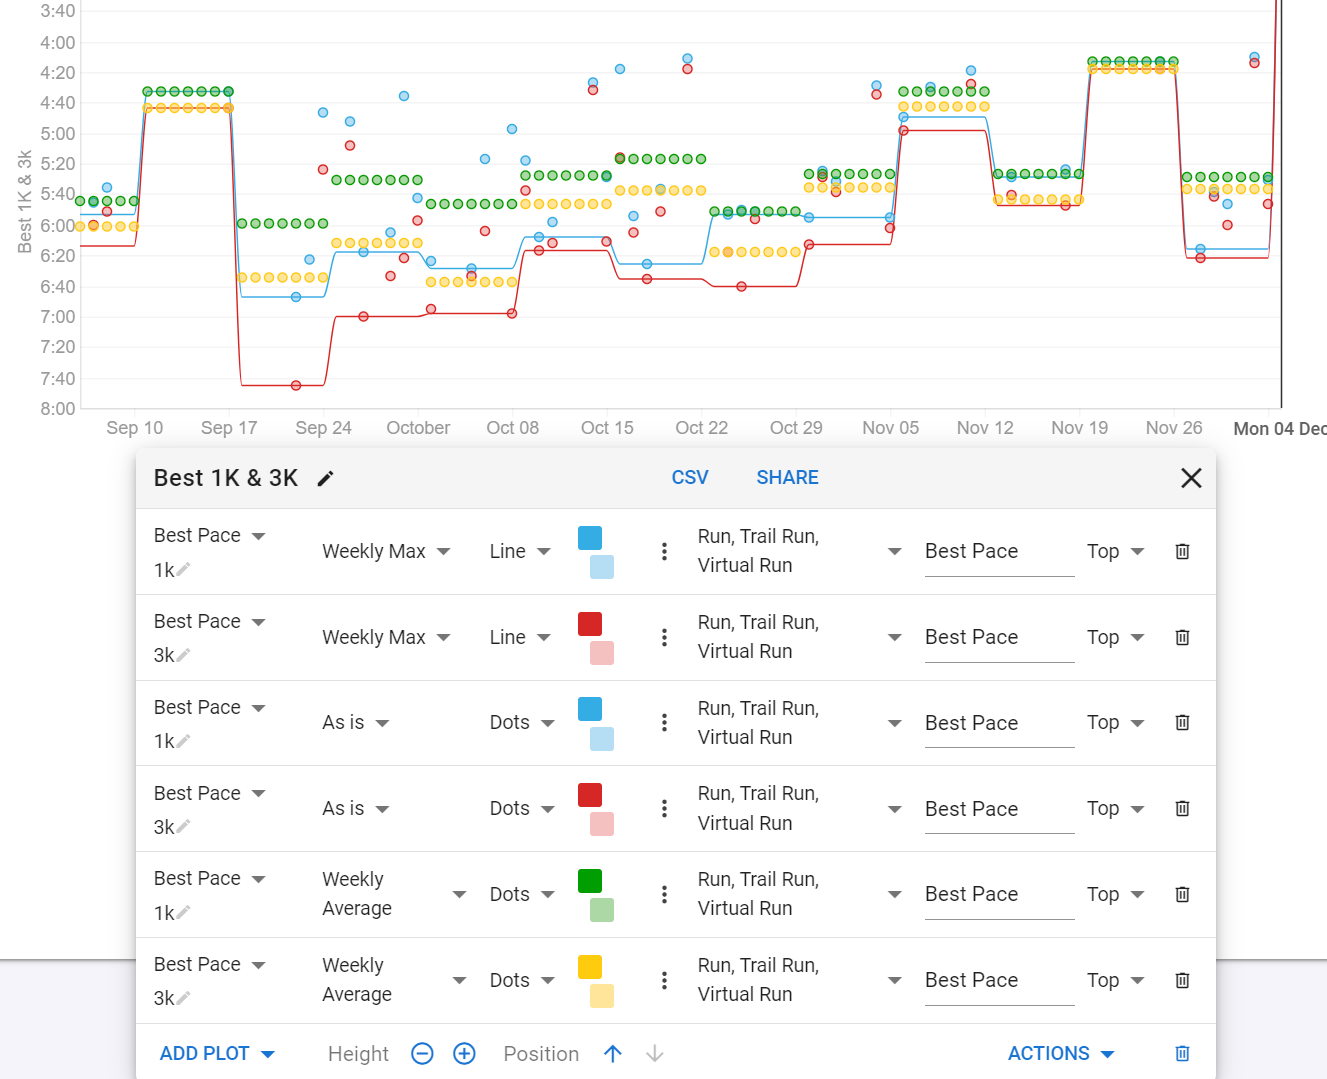
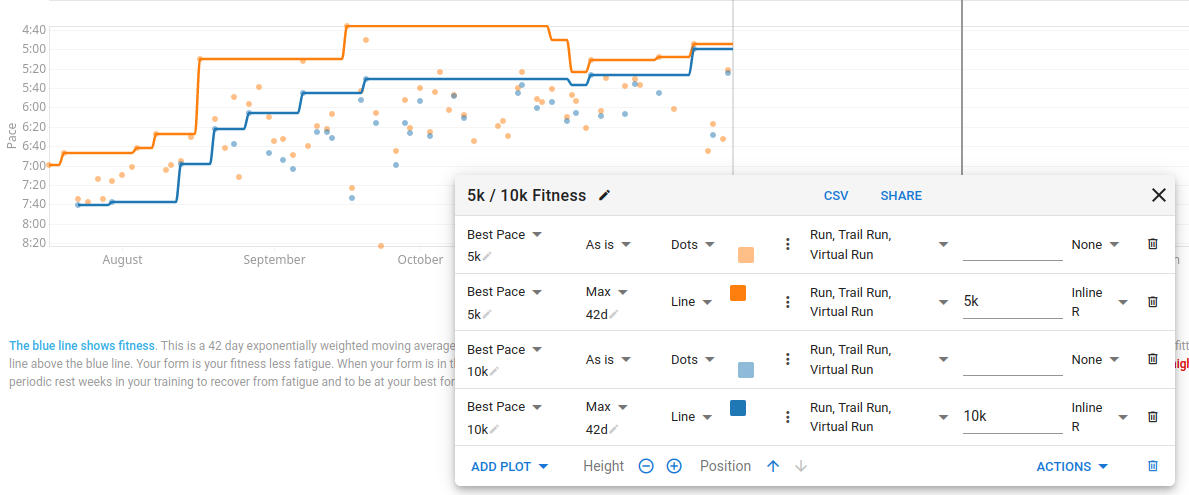
I’d love the ability to graph data by ‘minimum’ values for weekly and monthly. This would work well for graphing best pace values over time, ignoring training runs and just utilising best paces over time. I’m sure there could be other ways of utilising minimum instead of maximum too.
I have fixed weekly and monthly max to work properly for pace. I forgot that the pace data comes back in “seconds for distance” so smaller numbers are better.
there are some occasion when I need Minimums, like for instance temperature, or if I want to track “shitty” days of anything, or weekly and monthly min heart beats
+1 for this feature. I find tracking minimum weight over a period of time much more useful than average as it removes a lot of the noise - you can weigh more than your actual body weight from fluid retention, food still being processed, etc, but you can’t weight less than your actual body weight.
@david - is plotting minimum values over a period of time on the todo list?
Hello, I was also looking for that, I was about to do a request and found this topic. Could be usefull for different values as many have said in here. In my case I have a custom one about W’ bal that I would like to plot the min value, to track W’ depletion over time.