Activity start time is not available as a filter or plot parameter. All the rest can be done.
You could work with:
- Activity name if you have the auto-naming like Morning/Lunch/Evening Run/Ride
- Added tags: create tags for Morning and Evening which can be filtered on.
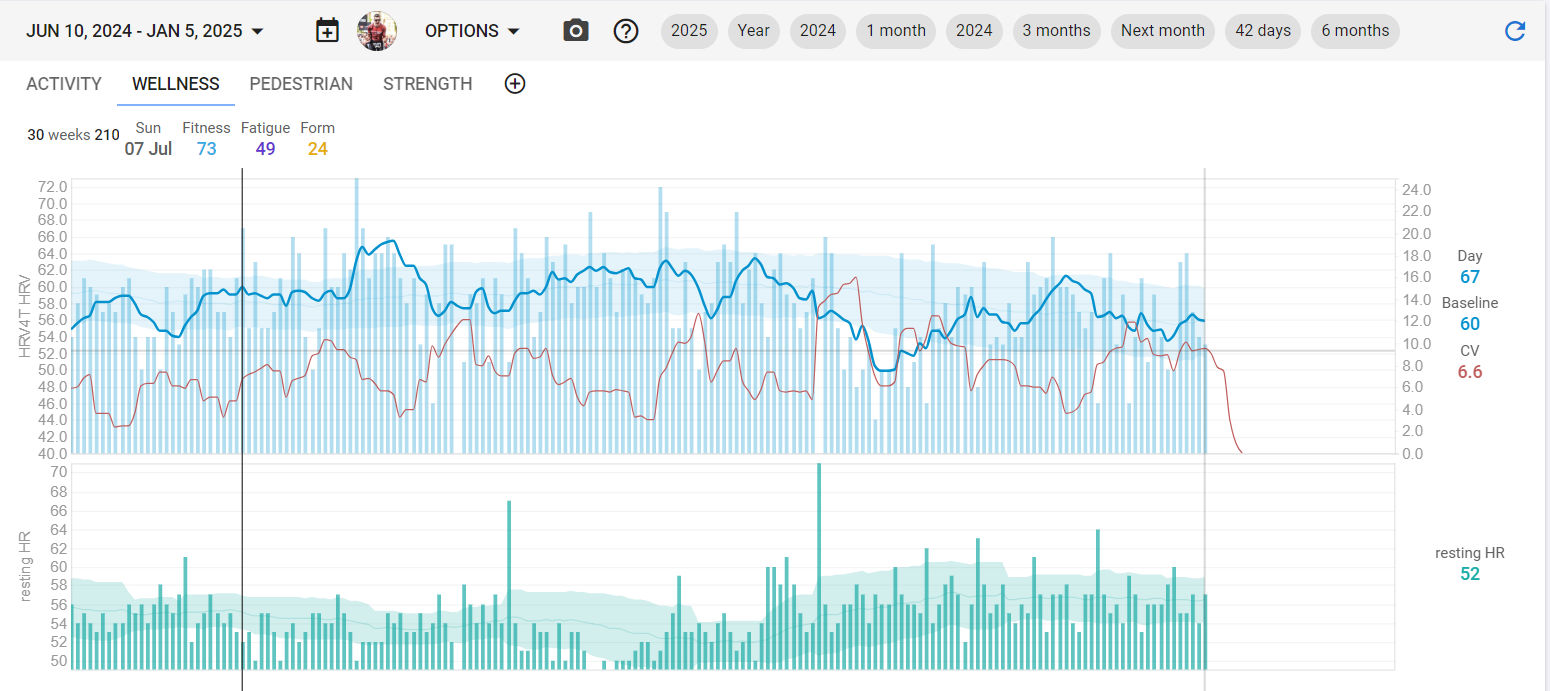
For HRV and RHR, there are shared custom charts available. Sleep quality is available from the standard plot metrics.
If you need more info on how to get these kind of charts, start here: