Feature request(s) for the gradient graph for activities.
My simplest request is that you add a zero line. The actual centre of the graph is a function of the minimum and maximum gradient, which makes it difficult to estimate where the zero line is because it’s often not the centre. Alternatively, you could switch to a zero-gradient-based histogram, so that negative gradients go down.
In either case, a nice to have would be to colour positive and negative gradients differently (perhaps red for up and blue for down, or whatever colour-blind-friendly primary or secondary colours work best).
Stretch goal would be heatmap colouring the columns. Preferably this would be done with a gradient that doesn’t saturate until close to maximum or minimum, so that max and min areas really pop out.
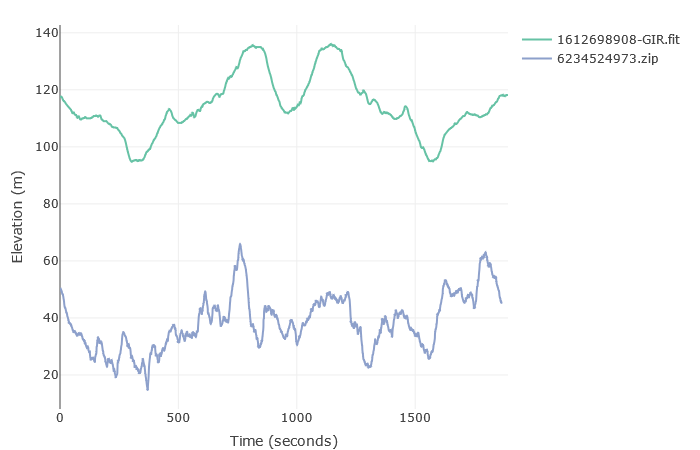
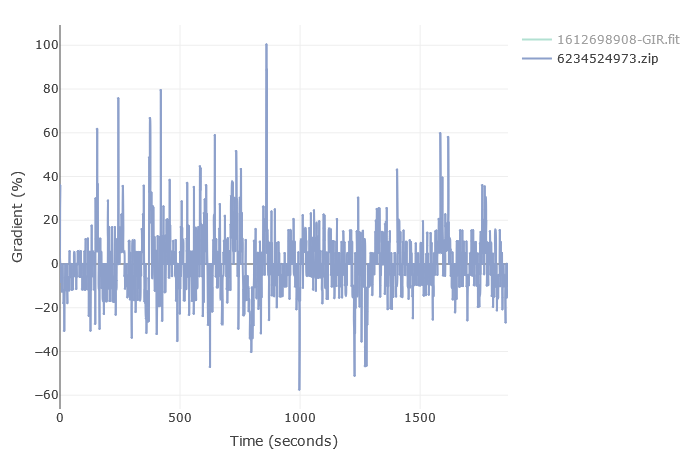
I’ll be interested to see how you get on with this one. I gave up on trying to apply a gradient adjusted pace because unless the source data is from a watch/computer with a barometer (or virtual I assume), or you make some sort of GIS sourced adjustment, e.g. like strava and garmin connect do, then the elevation changes are garbage. Here’s a run with elevation from both my stryd (Green, with barometer) and FR735 (Blue, no barometer). Annoyingly the can’t get Garmin to accept the stryd data as an alternative elevation source so the garmin fit file always contains the garbage version! Second plot is the raw garmin second-by-second gradient
Tx for this info. The altitude graph looks “ok” so I am hoping that gradient can work with enough smoothing. Not planning on trying to do gradient adjusted pace at this time. Hopefully running power will make that less necessary!
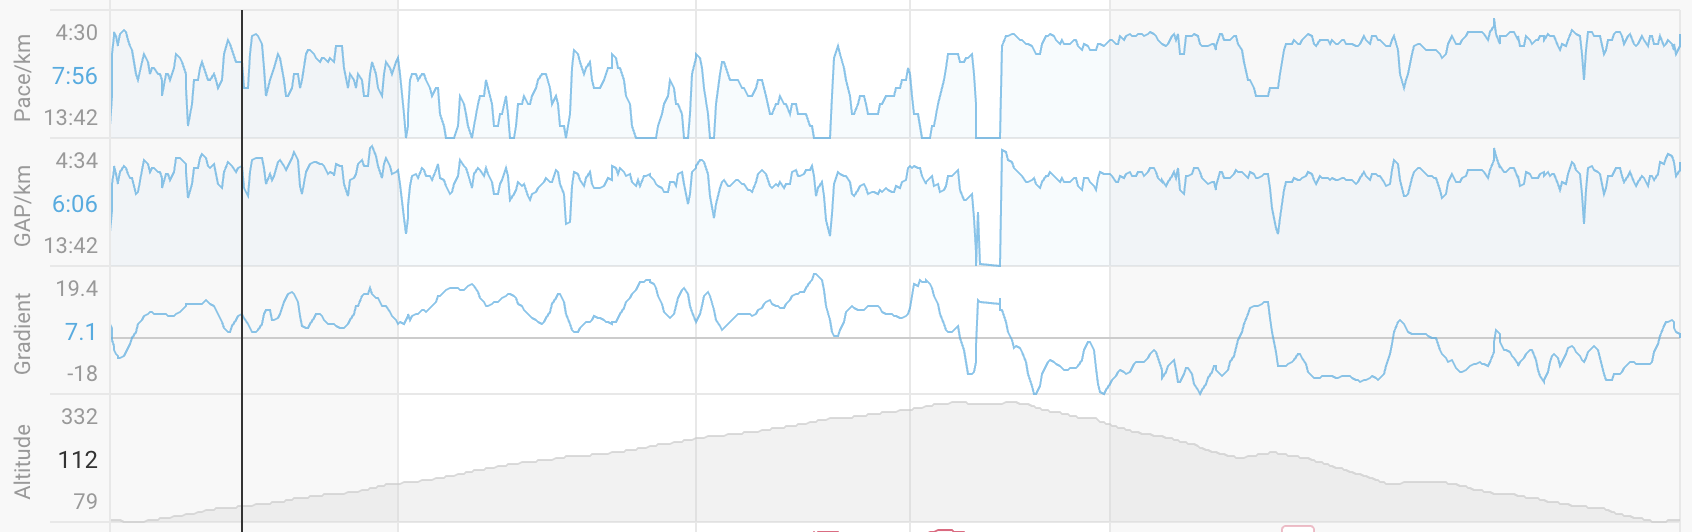
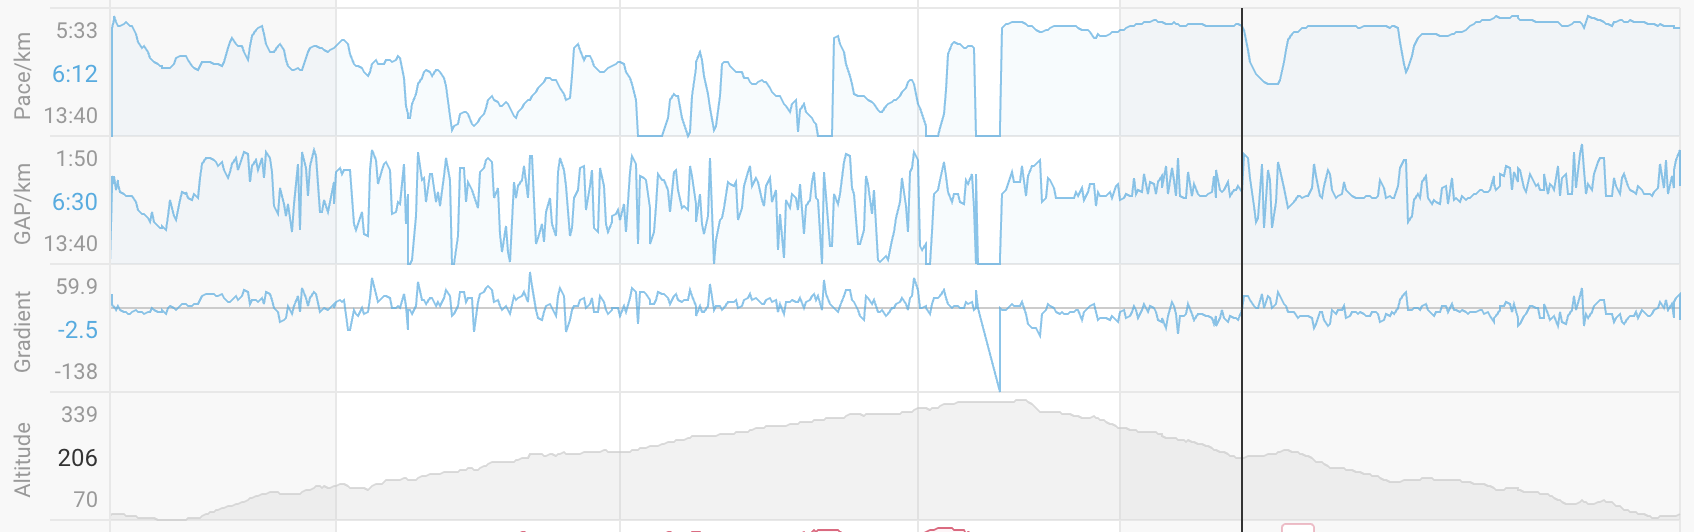
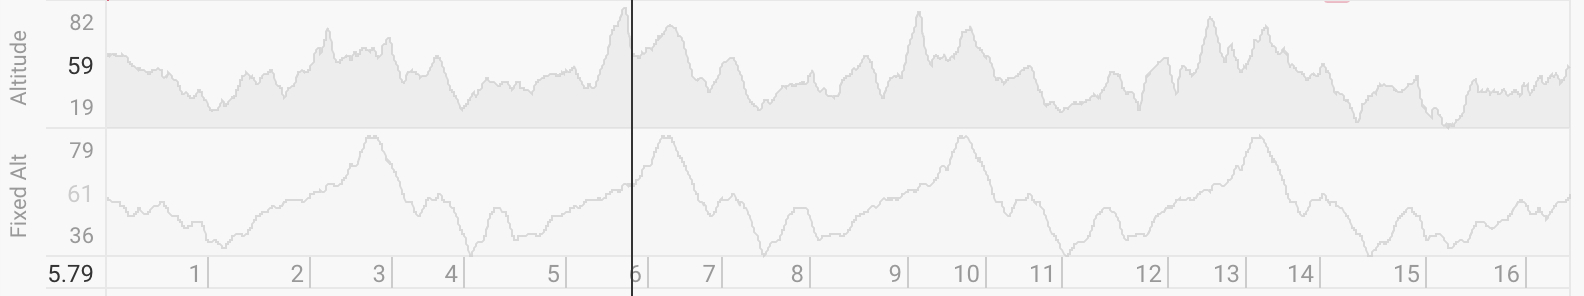
I am going to have to fiddle with this quite a bit. The data from Strava is very cleaned up compared to what comes from the Garmin. Trail run up a mountain and down again:
As far as I know Strava, TrainingPeaks, TrainAsOne etc. and even Garmin Connect (i.e. what you see in the garmin app charts) does an altitude correction based on the Lon and Lat, so essentially ignores the raw altitude measured by the watch. But annoyingly even though Garmin Connect does this the raw altitude is retained in the FIT file. I tried to do this but it didn’t work very well (and was slow!). The only time you get a good raw altitude reading is if the watch/bike computer/footpod (i.e. stryd) has a barometer (like my plot previously). Not sure what the answer is, even smoothing doesn’t work great, I think alititude correction is the answer its just finding a good high resolution (and free) worldwide source.
Altitude/Grade is another example of Garmin lacking any true innovation. They are sitting on a whole pile of data (where people run and bike with barometers in their devices) and it would not take rocket science to compile high resolution elevation maps from those.
Even with a built in barometer the data is still not very good. Example: Ride a 5 hr loop, and voila: you just gained or lost altitude, depending on wether the air pressure dropped or rose…
Looks like it misses some features from your loop. The data is messier than I expected. Think it might be GPS points jumping around so maybe I need to try smooth that first. Hopefully after all this I can get better GAP data!
Oh and it is definitely slow!
lookupAltitude 1000 points in 1818 ms
lookupAltitude 1000 points in 1514 ms
lookupAltitude 1000 points in 1441 ms
lookupAltitude 1000 points in 1441 ms
lookupAltitude 313 points in 580 ms
I can do all that in parallel but still need to see if I can find something quicker.
I’ll dig in to my old code to see what I was using in R. The profile doesn’t look too bad. That was a threshold session round an undulating 2ish mile loop with about 0.75 miles at the beginning and end to get to the loop. GPS plot on a map doesn’t look too bad.
Annoyingly the google maps resource for this kind of thing hasn’t been free for a while.