I have a question regarding the calculation of the gradient shown in the charts of an activity.
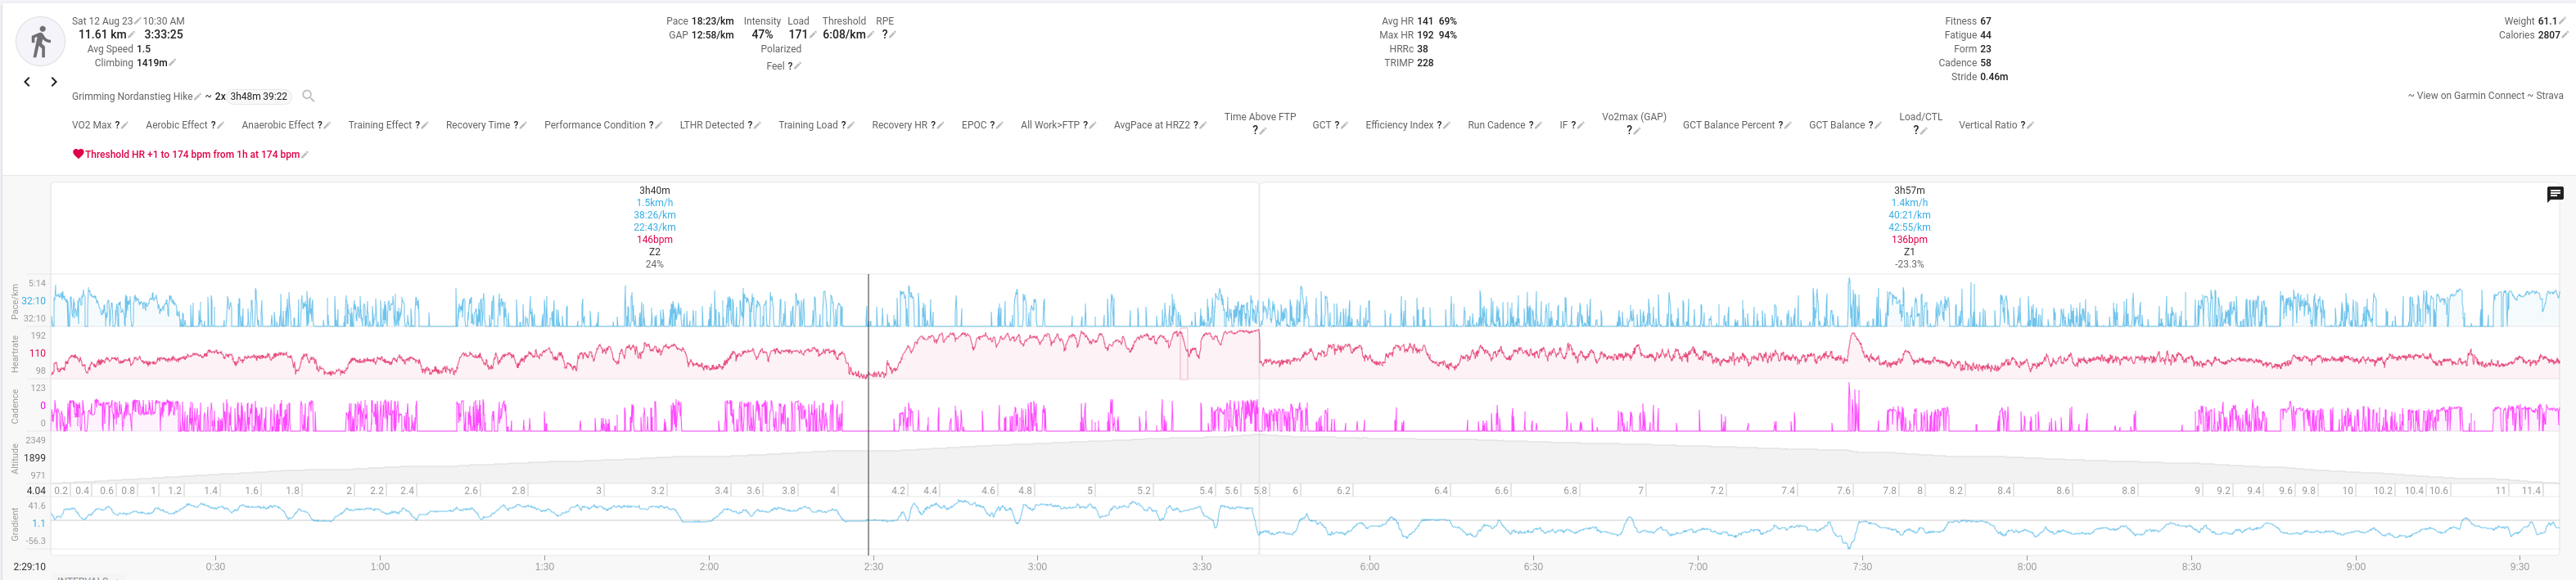
Here is a screenshot of a recent mountaineering activity on intervals.icu.
I used the Fenix 7 SS, the terrain was very steep and challenging (for me and for the GPS Antenna).
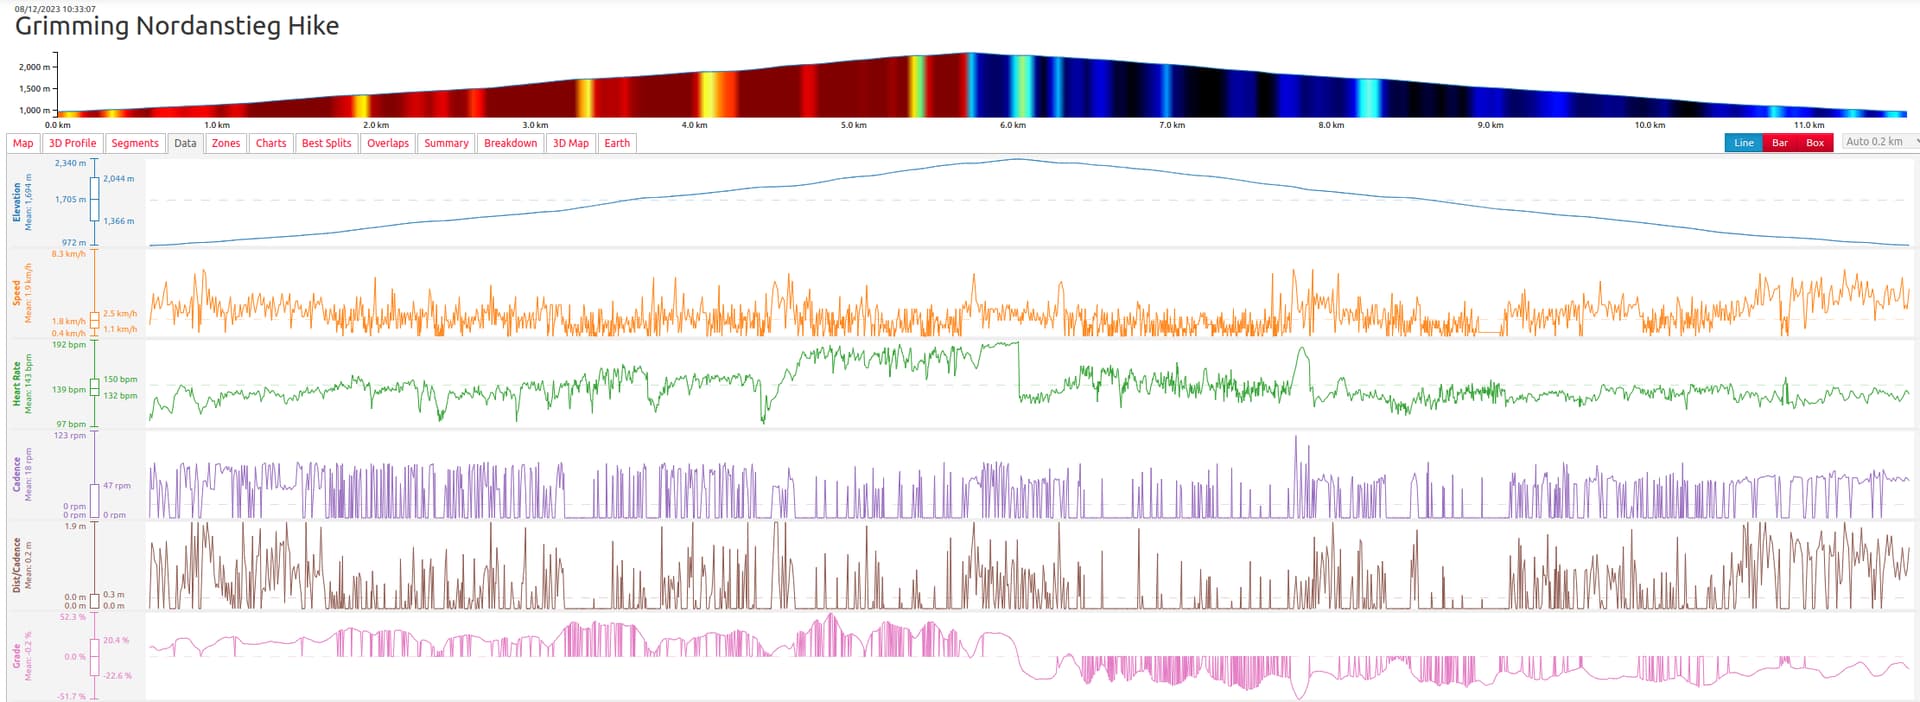
In the Grade-Chart of Veloviewer, there are lots of drops to zero. The reason being, according to the developer, that there are changes in lat/lon in a new point in the data, while elevation has stayed the same. Therefore, a grade of 0% is shown in the data at that point. I have turned on Every Second Recording on my Watch, and there are lots of points with the same elevation data and probably just miniscule differences in the lat/lon data.
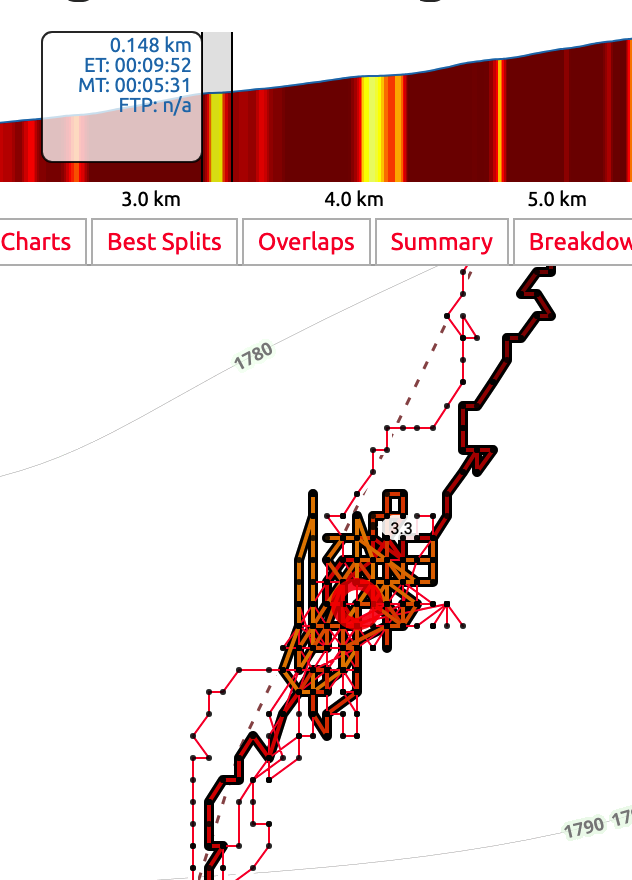
Looking at this specific section, I was taking a break and my watch was recording lots of movement, even though I was standing still.
The average grade value for the uphill section in VeloViewer is 21%, the one for the downhill section is -21%. These values are smaller in comparison to intervals.icu (± 24%) because of the frequent drops to 0%. (I suppose, that this is the reason). I did not use the Stryd Footpod for this activity. The Stryd Footpod seems to improve the data and therefore also the grade charts shown in VeloViewer a lot, though (example).
The tracked length of the mountaineering activity was 11.61 km. Climbing was 1419 m. The gradient for the up or down section would be ± 24% (as shown in intervals.icu).
The theoretical (planned) length of the mountaineering activity should be around 8.7 km. Ascent, and descent should be 1378 meters. The theoretical gradient should be 0.32%. It would be interesting to see what the real distance and ascent would be for a perfect GPX track (which mine is not).
While I prefer the intervals.icu version, I am wondering why there is such a different behavior. Is there some kind of smoothing applied to the data before it is being shown in the gradient chart?
Intervals.icu uses the altitude data (from your watch because you have elevation correction off) and GPS data (to get distance between points). It calculates the gradient over a rolling 50 meter distance window to smooth out GPS jitter (and missed points) and short little bumps.
The average gradient of an interval = (ending altitude - starting altitude) * 100 / (ending distance - starting distance). So it doesn’t use the gradient stream for that.
Yes you can do that with a custom interval field working on the gradient stream. Click Fields → Add Field and enter this in the script box:
{
  let grade = icu.streams.grade_smooth
  let tot = 0, c = 0
  for (let i = interval.start_index; i < interval.end_index; i++) {
    let v = grade[i]
    if (typeof v === 'number') {
      tot += v
      ++c
    }
  }
  c ? tot/c : null
}
When you run it to test it uses the data for the currently zoomed part of the chart.
I just tried that, and the resulting average raw gradients for the two intervals are +19.17% up (vs. 24% for the average interval gradient) and -17.64 down (vs 23.3%).
So the raw gradient of the fit file really does very weird things in comparison to the real gradient calculated with the start and ending altitude.
when I parse the GPX/TCX/FIT to also generate slopes to simulate outdoor rides “indoors” that is what I do as well. The raw data is just way too spiky and too much variations.
I am still surprised, that, for an interval of nearly 4 hours, the average raw gradient from the fit file yields such a different result to the real gradient calculated with the start and ending altitude.
I don’t understand where the change in altitude can get lost in there
GPS drift, Barometer changes due to weather changes things like that.
I think it’s like a accelerometer, every little change is recorded and it’s too much, so in order for it to be “make sense” you have to process it a littlt.