I would like to be able to see the distance I ran on the main chart, however I have a few problems.
Because I often take walking breaks on longer runs, this makes it difficult to only get the distance of actual runs.
I have tried adding a filter for pace on the distance plot, but this seems to filter out a whole activity, rather than parts of an activity.
If I set pace zones, then I can see time in zone correctly however, this is not distance and also, I do not know if I can combine multiple zones into a single plot line (except for the pre-sets).
Maybe I am missing something and this already exists, in which case I would be grateful if someone showed me how.
Otherwise, I think it would be great if we could filter also on the interval level, instead of only the activity level.
// get data streams
distStr = streams.get("distance").data
velStr = streams.get("velocity_smooth").data

distThr = 0

// iterate over data streams
for (let i=interval.start_time; i<interval.end_time; i++){
dist=distStr[i]
vel=velStr[i]

// if velocity is above 5x3.6 = 18km/h
if(vel>5){
// acumulates velocity points
distThr = distThr + vel/1000
}
}

distThr = distThr
You have to multiply the 5 with 3.6. So the threshold velocity in this example is 18 km/h. It will only sum up the velocity points if it’s above a threshold. The sum of all velocity points is the distance. I tried this with a bike ride example, so maybe you have to adapt the velocity stream for running (don’t know if it’s the same).
If you want this as a stream (graph), you could do it this way:
{
let speed = icu.streams.velocity_smooth
let dist = icu.streams.distance
data[0] = 0
for (let i = 1; i < data.length; i++)
{
if(speed[i] > 5)
   data[i] = data[i-1] + speed[i]
else
   data[i] = data[i-1]
}
}
If I understand your situation correctly, the best thing to do would be to use the ‘Lap’ button on your device and have Intervals ‘Use Laps’ iso detecting intervals. Every time you transition from walk to run or the other way round, push the lap button.
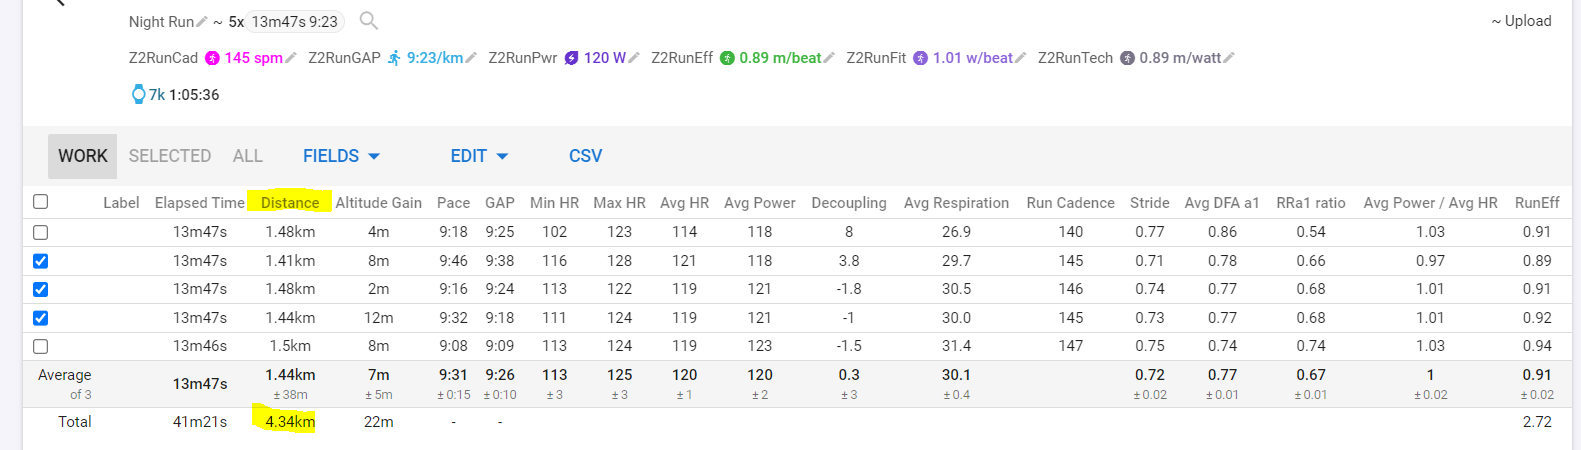
On importing your session, you will have all intervals and on the Intervals data page you can select all Run intervals and see the summary at the bottom of the table.
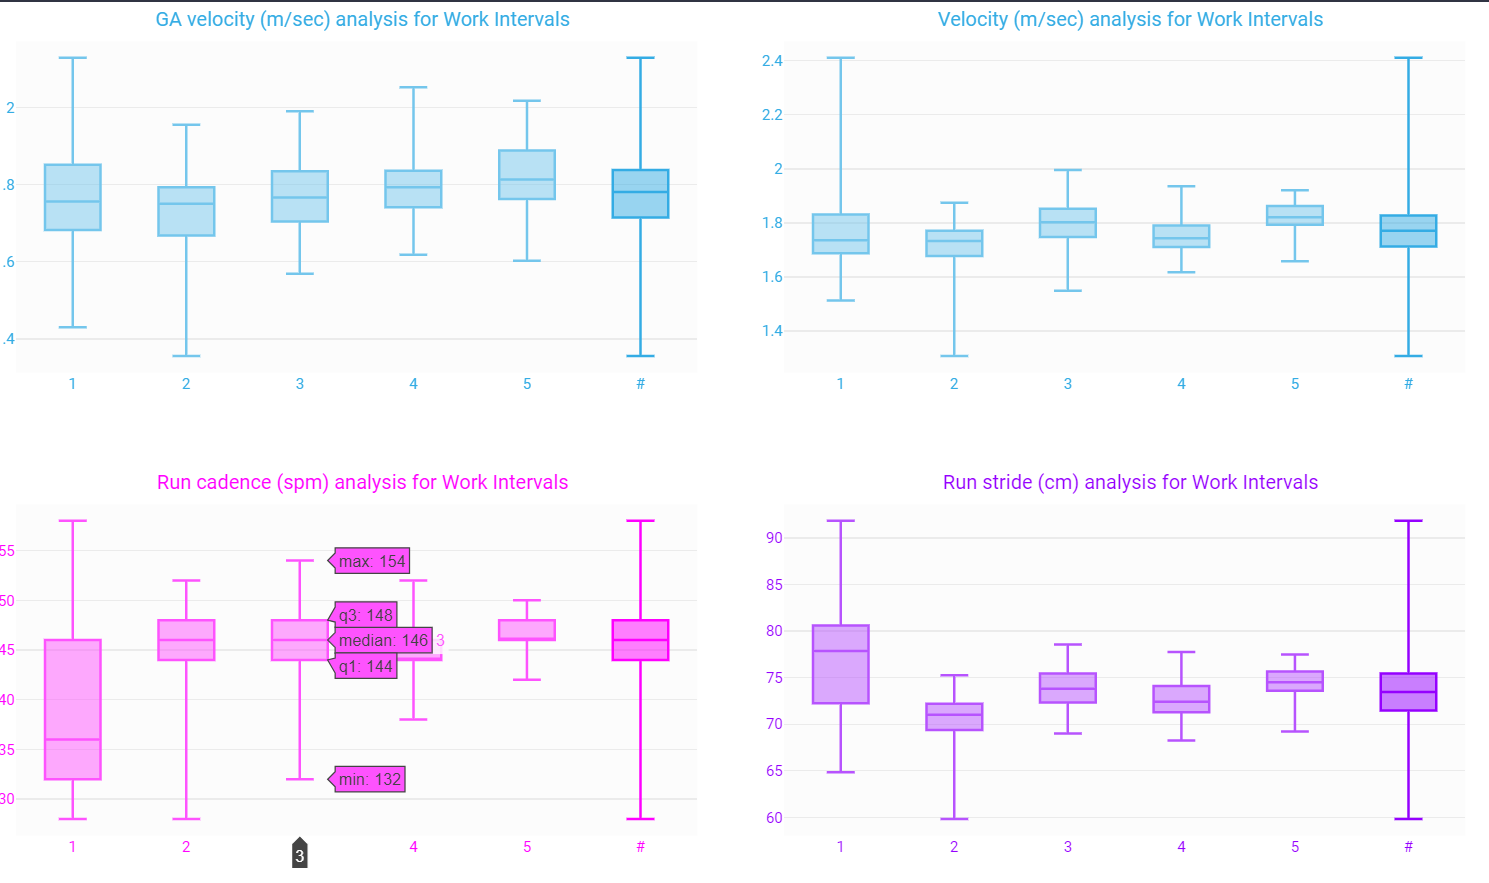
You could also use the boxplots I made recently to make that visible. If you give the Run intervals a label ‘Run’, you will see a boxplot for each interval and an additional one for the grouped intervals.
Thank you for your kind reply, the box plots look super interesting!
However, if I understand what you have show correctly, it is not quite what I was looking for. I wanted to see how much distance I ran each week over a long period of time.
Preferably alongside the fitness chart.
I am happy to manually label which intervals were running, but I have not found a way to use that info in the long term chart.
If you label your intervals or only keep the running parts as ‘Work’ intervals, you can make a custom field that sums the distances for the choosen intervals.
What you then need is the interval.distance metric for all ‘Work’ intervals or all intervals that have label ‘Run’ for example.
It shouldn’t be too difficult but anytime you change intervals, you will have to reanalyse the activity to update the Custom field. Custom fields are only calculated once on initial analysis.
Once you have that Custom field, you can use it on the Fitness page to chart as wanted.