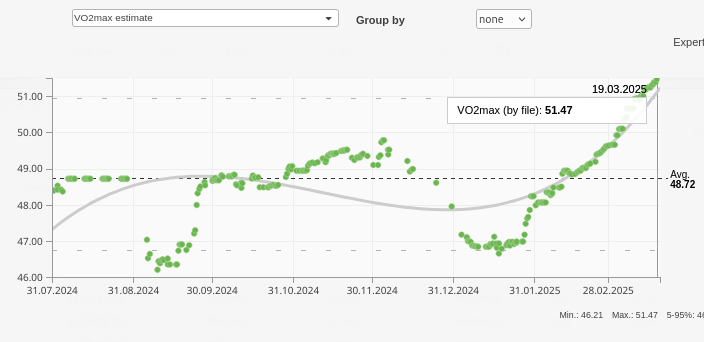
It seems I can only get a graph of vo2max in round numbers. Is it possible to get the data from a garmin fit file and display it something like this? (from runalyze):
Even better if it could overlay alternate vo2max estimations via other methods too. I had a look in the forum archives and it seems this has come up before, but not sure I could find a conclusion.
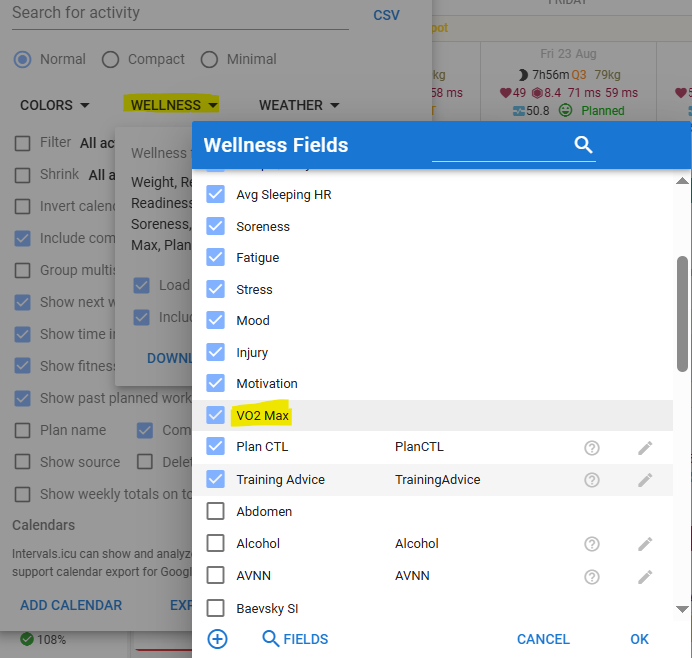
Vo2-max is displayed for each activity (where it is calculated by garmin) with many decimals, but you have to create a custom field for it and also make a custom graph. I think.
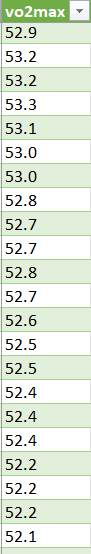
The value displays a whole number in the Wellness tab, but in a CSV export, or through the API, it shows as a decimal (see example below). It will only populate if you have an activity, cycling and running, and can change depending on what each value is. Example, my running is about 6-8 below my cycling value.