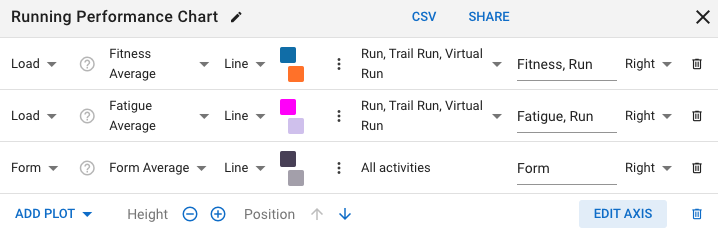
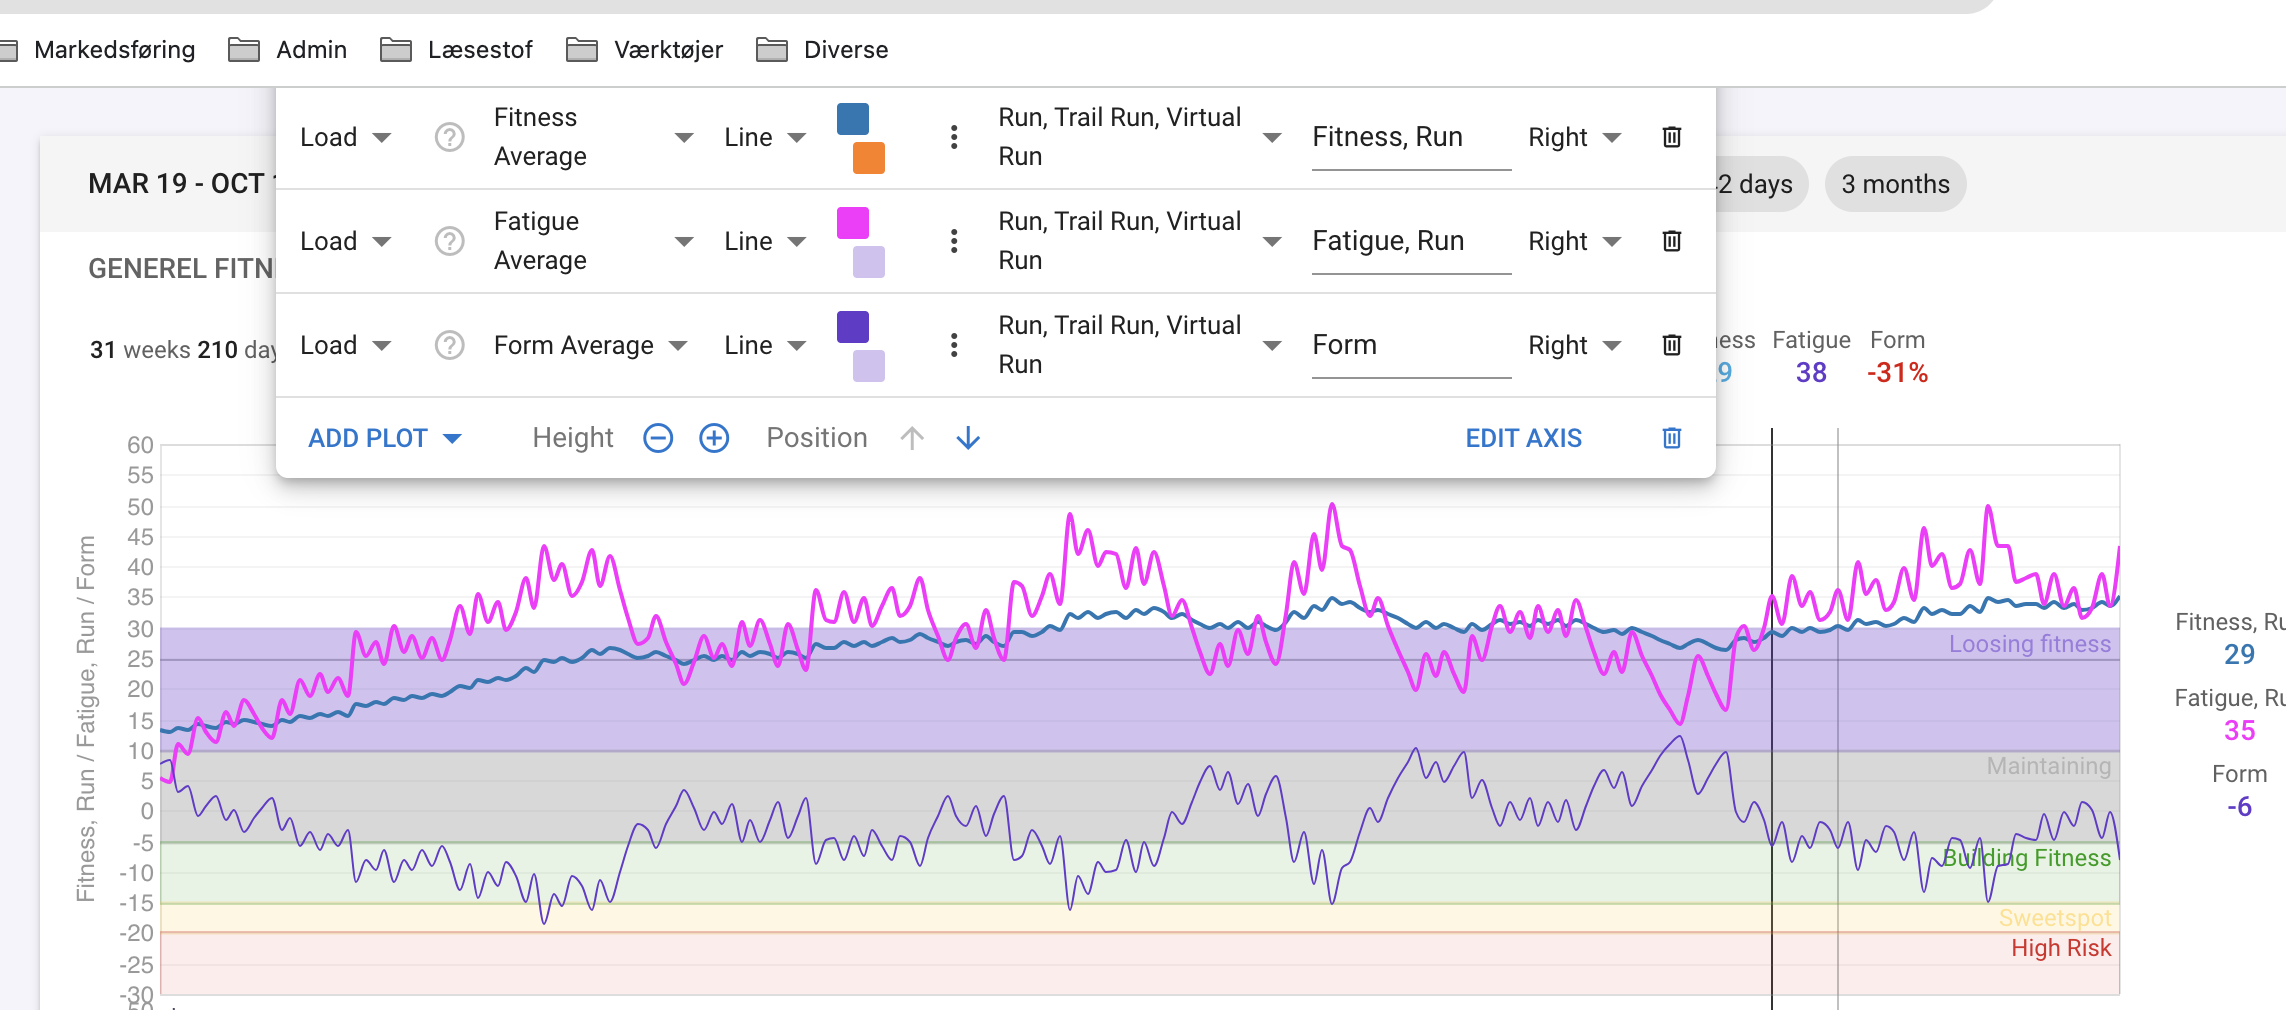
I would like the option to see load (fitness and fatigue) just for running.
I have plotted that as shown on the attachment.
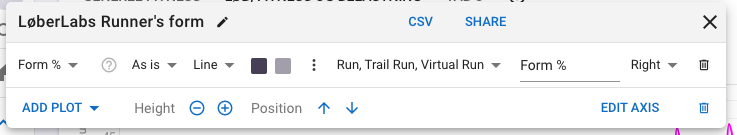
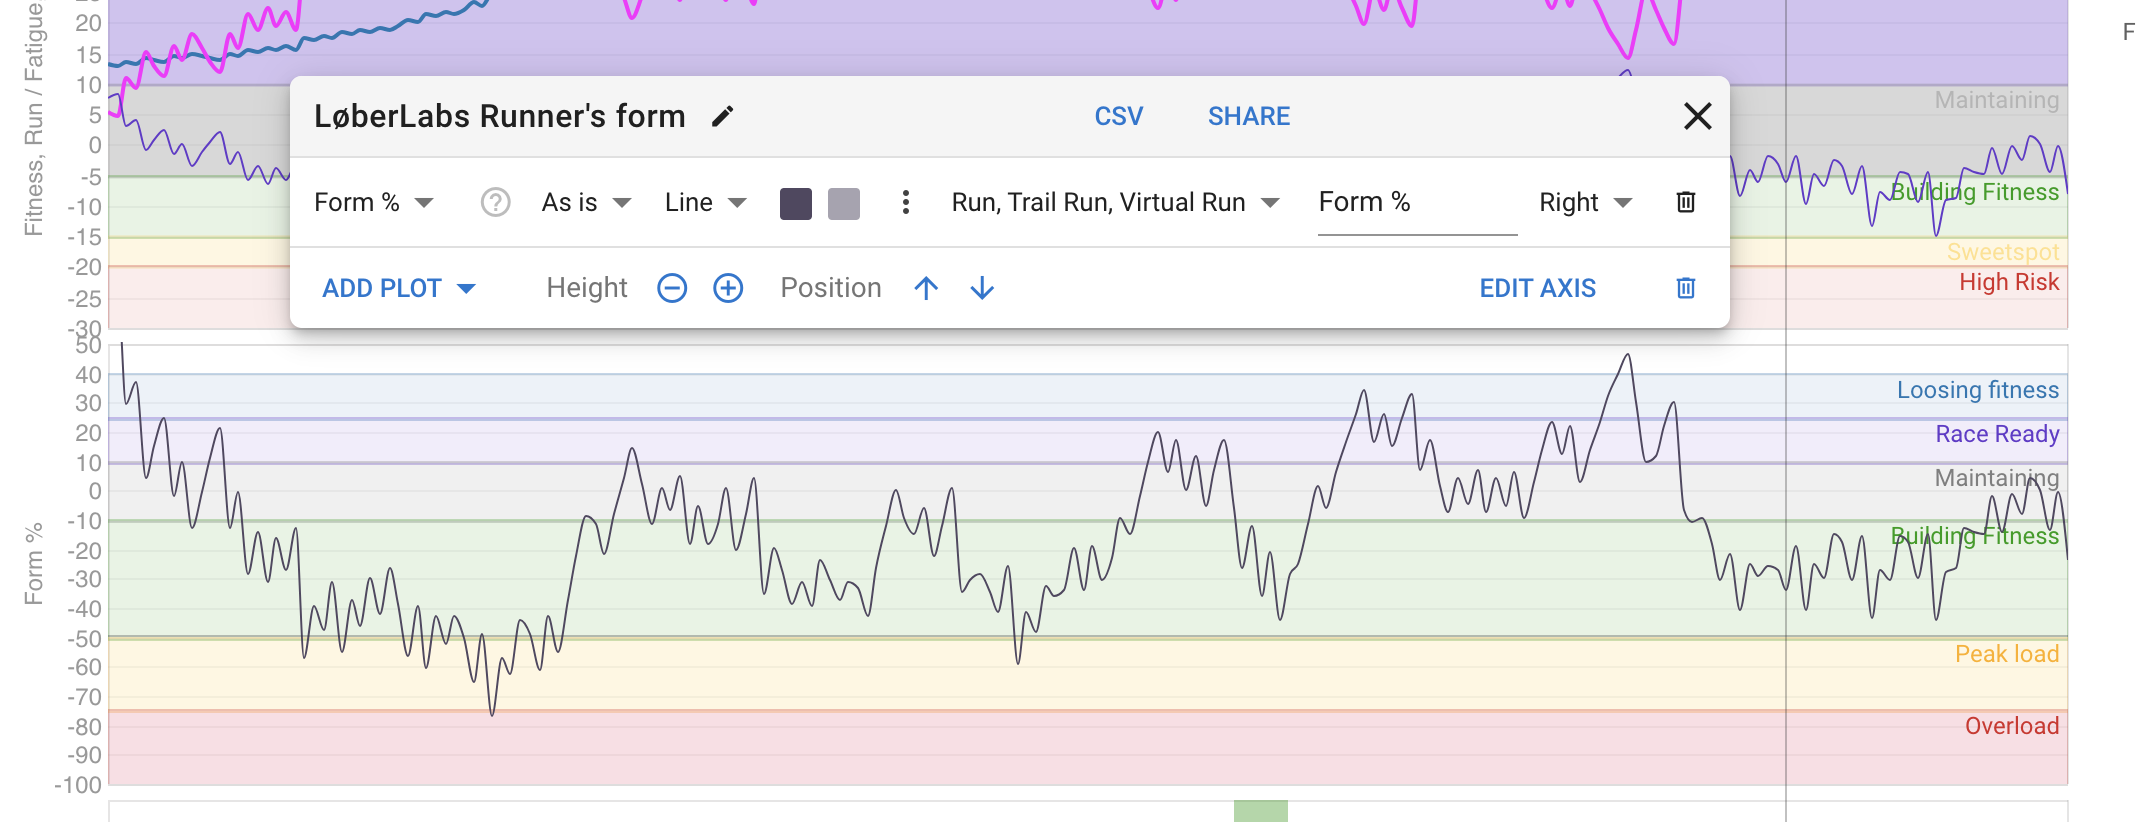
I want to see %form for running, and it has the option to just filter for running.
Despite that, other activities still influence the curve.
On tjhe %form curve wee see big drops in %form induced be cycling activities as shown.
I am a physio and work a lot with injured runners.
In this setting it is nice to see loads from running exclusively as swimming and cycling might not affect an achilles tendinopathy at the same ratio.
Imagine the “local load” being more substantial on specific structures with running compared to systemic load
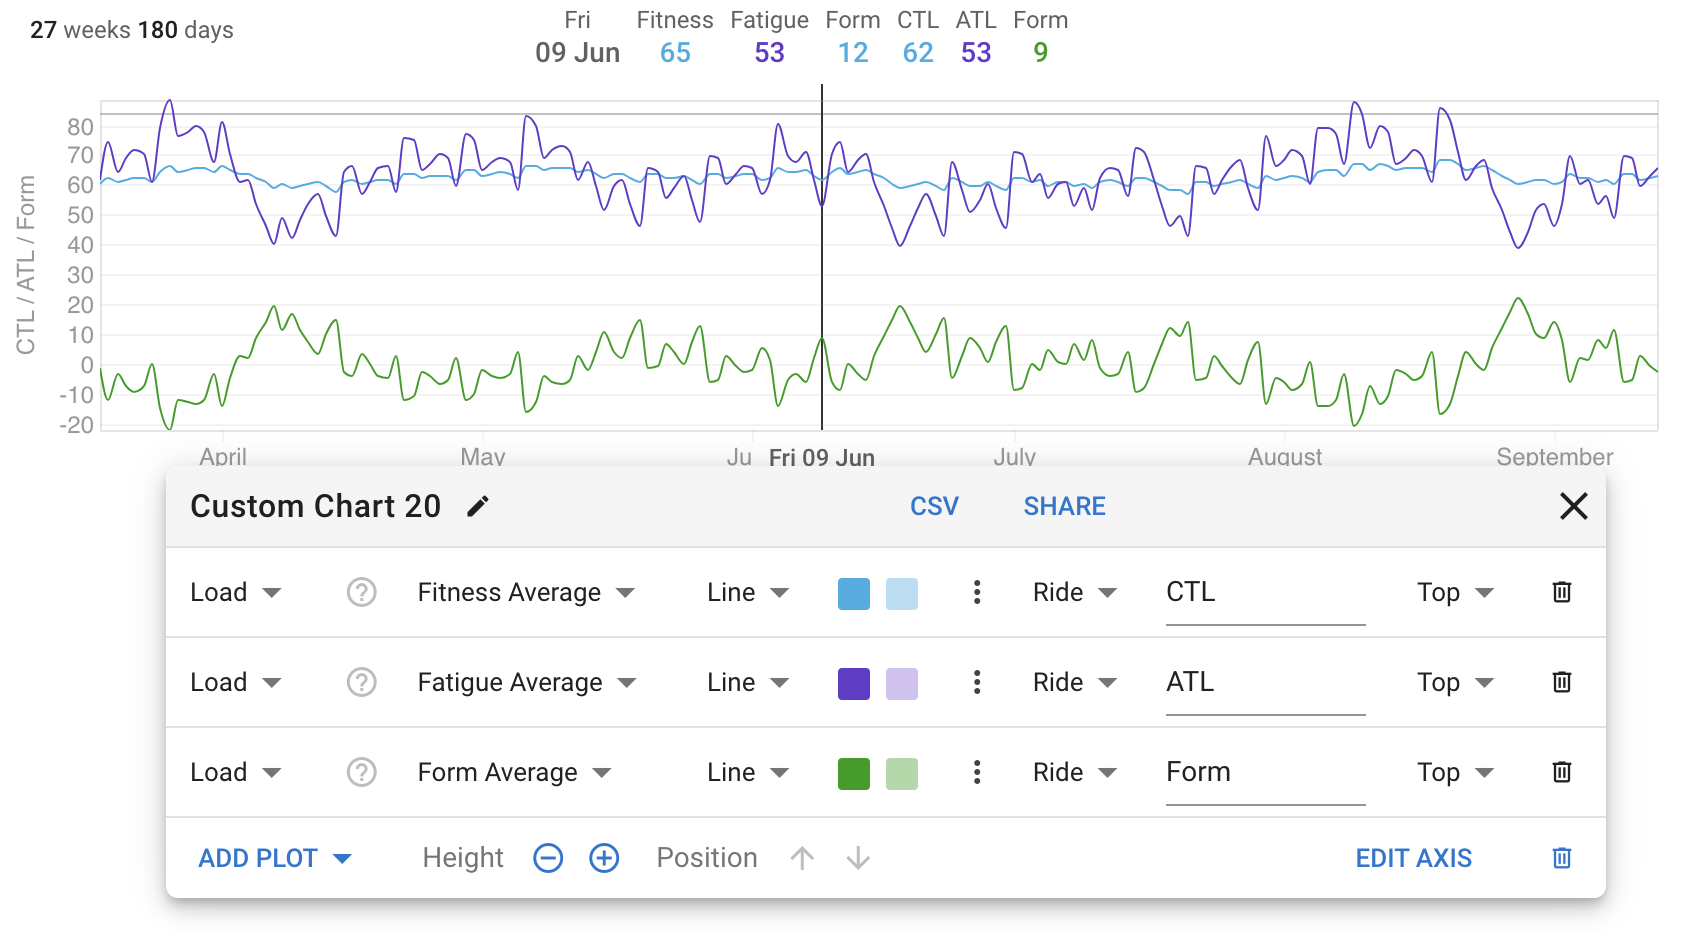
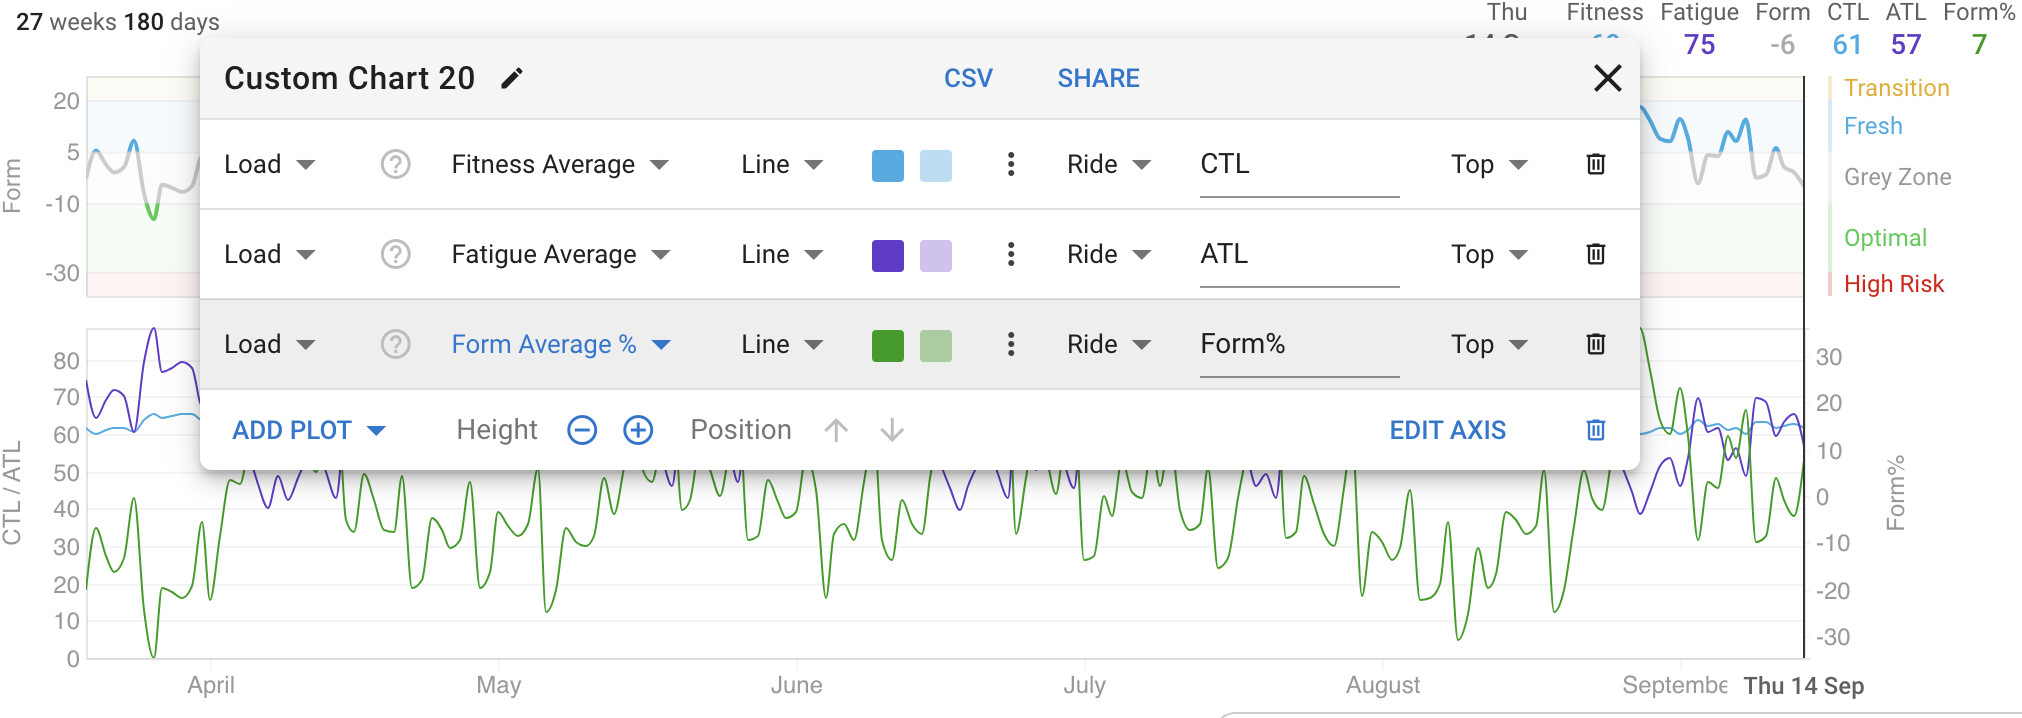
Form is the result of calculation from Fitness and Fatigue, filtering on Form only will not give you the result you´re after.
You will need to build a Fitness graph that includes runs only, and displays Fitness, Fatigue and Form per discipline.
Ah like that. Starting from Load and using only Form as the end result should work. All calculations are done behind the screens in that case. Nice, missed that for some reason. Probably just quickly scanned that post without realizing what it actually can do.
Thank you for all the help David!
I like the idea of form% of fitness.
That is actually what the post is originally about.
On the above picture you can see that i have tried to sort form% for running-activities.
However, cycling and other activities affect the graph.