Hello,
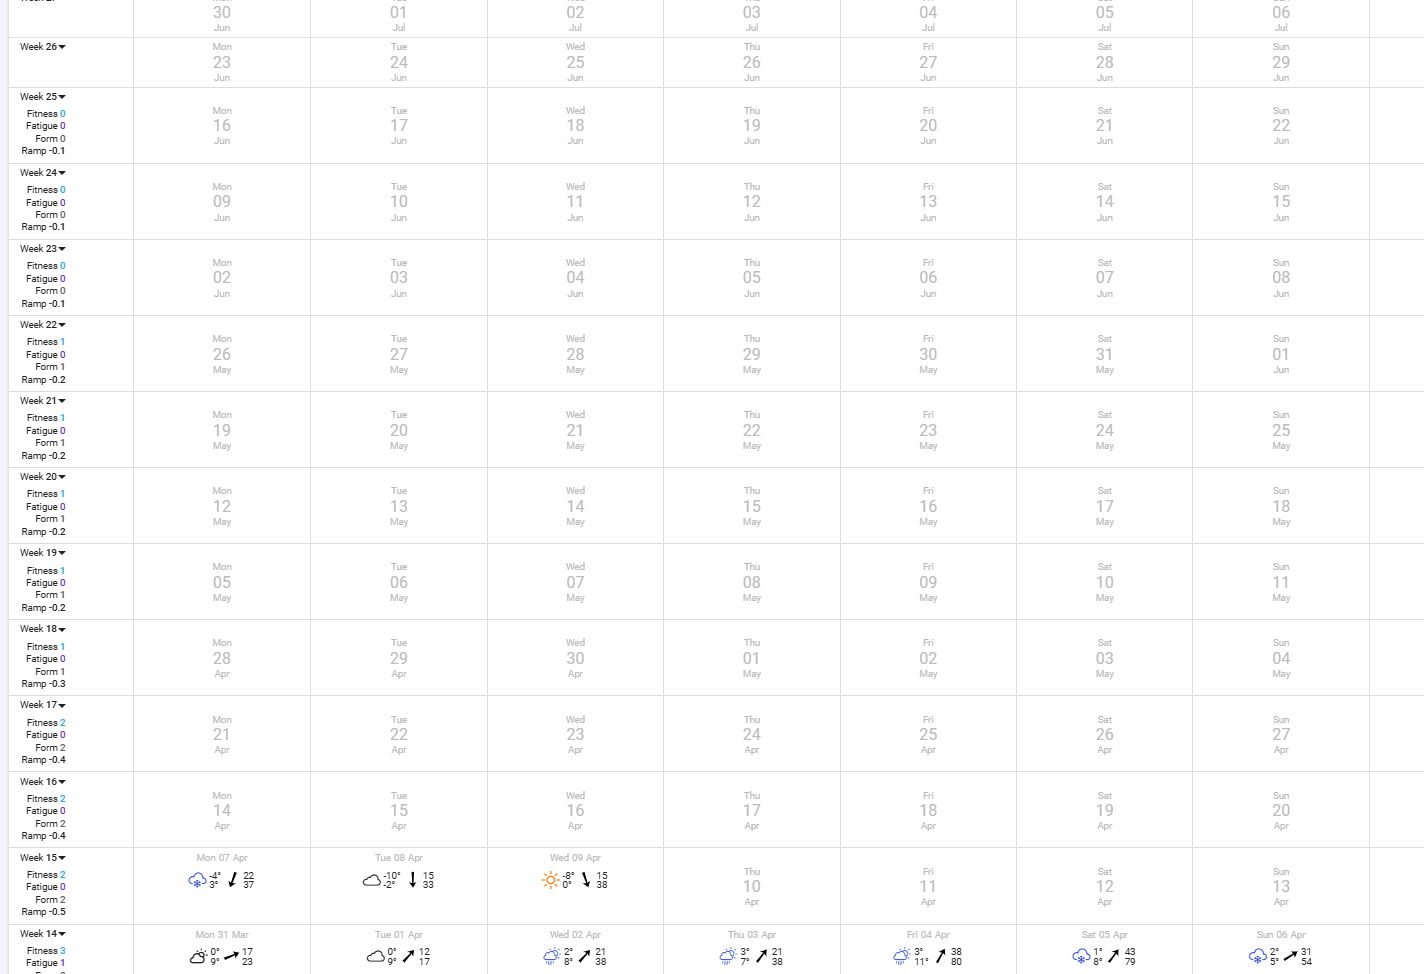
The fitness line in the future looks quite strange:
It seems like there might be a bug in the logic behind this graph — I haven’t seen such drops until the past few weeks.
There are no planned activities in my calendar for that period (or for any period, actually):
That´s surely caused by graphics resolution and rounding on Fitness numbers with those low numbers.
1 Like
Thanks for the reply!
I’d like to note that such low fitness levels are not exactly rare for me 
I’m not sure I understood correctly about the “resolution” — is this issue supposed to go away when viewing a “shorter” segment?
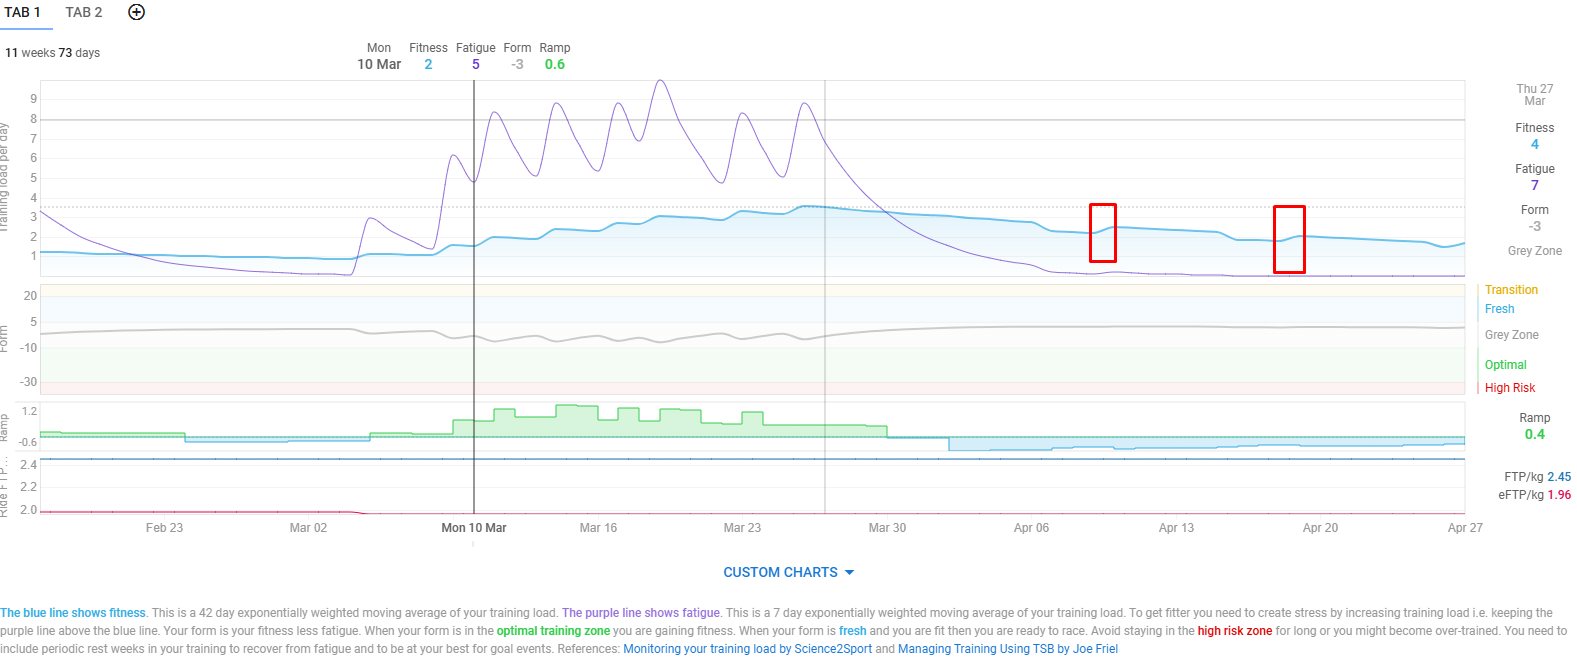
It still persists:
If this is just a floating point rounding issue, it’s not quite clear why the “steps” don’t always go downward — why do upward “steps” appear?
Also, why does the occurrence of such issues depend on the absolute value of fitness, if it’s a rounding issue?
Fitness is a 42 day weighted average of TSS and takes ‘steps’.
And by resolution, I mean that especially Windows is very bad at drawing lines that are not horizontal or vertical.
All these cosmetics ‘disappear’ when the numbers are above 20-30.
2 Likes