Hi, since (I don’t know… maybe 1 or 2 days ago) I’ve noticed that custom fitness charts with the “auto” minimum Y-axis value are now fixed at 0, instead of adapting to the minimum displayed value as they did before.
This is quite problematic for many charts, for example, even a simple weight chart becomes much harder to read and basically unusable.
If I’ve missed any recent changes or new settings related to this behavior, I apologize, could you please explain how to restore the previous functionality?
In this specific case (see screenshot), I haven’t made any changes to the chart, yet until a few days ago the minimum value on the Y-axis matched the lowest recorded weight, or at least something close to it definitely not 0.
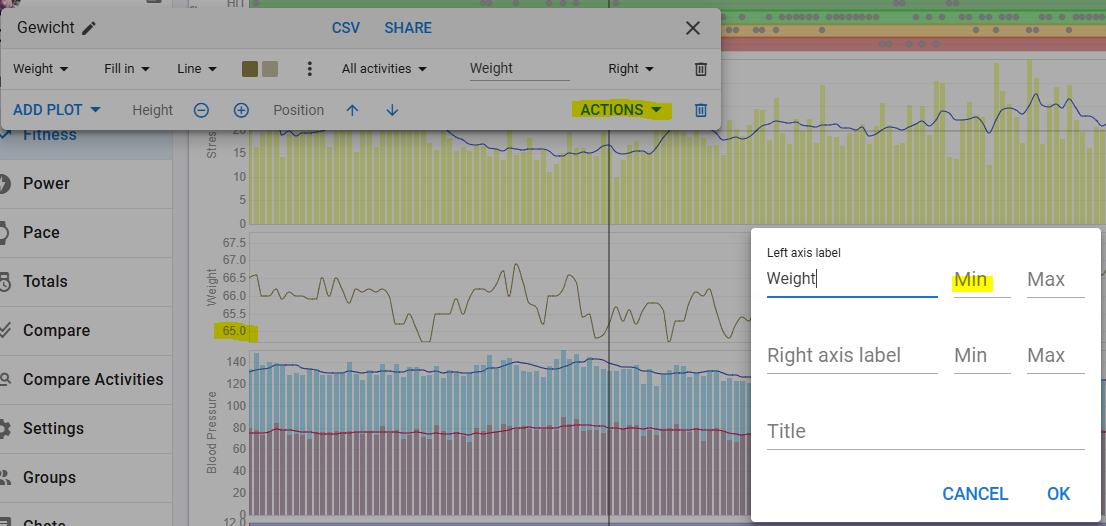
If you can’t click on the left axis, make a new chart with the plot you want.
Then click on Actions - Edit axis and enter a min value.
But as you can see from the screenshot, I don’t have a minimum set and the chart displays correct with auto-scaling.
Are you sure there’s no 0 value?
I’m having the same issue; auto scaling no longer seems to work on all of my fitness graphs.
First noticed it yesterday, and it worked perfectly before.
1 Like
I can confirm that I have the same on some of my charts, HR rest for example.
I can’t find out what is causing it to behave like that for some and not for others. Weight for example, does not show like that in my case.
@eva may need to take a look.
1 Like
Thanks @eva, I can confirm it’s working as before again!