Implemented in https://forum.intervals.icu/t/custom-activity-heatmaps ![]()
Okay, as this did not seem to happen in i.icu yet ![]() I went ahead and created a workaround
I went ahead and created a workaround ![]()
Maybe someone could implement this as a Javascript extension chart for the i.icu Activity power page?
I would be happy to advise and help fine tuning the output, but unfortunately I don;t have time to get into the javascript and display details to be used (t)here;-)
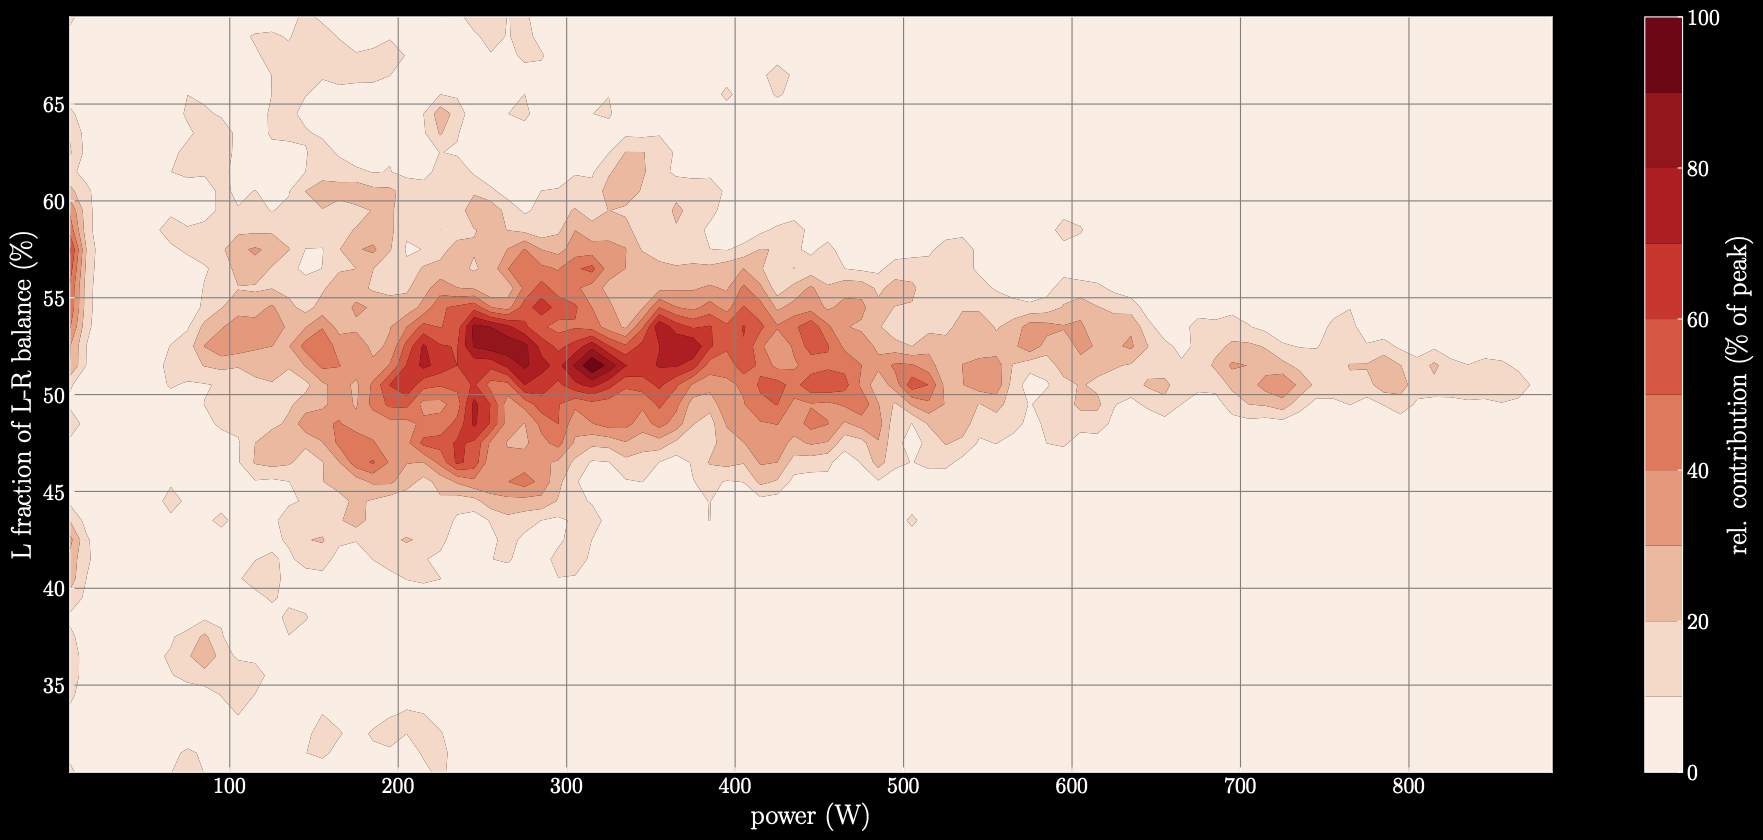
I created a (standalone) Python script to retrieve power and L/R data for an i.icu activity, create a 2d-histogram of this, and plot it as a contour plot.
Typical result are like this:
recovery:

crit: