Yes, I manually deleted the Strava-imported activity in i.icu.
The “<1 min” fits😟
The FIT file (on intervals.icu) has a workout starting at 06:33 PM with a duration of 44m20s.
Strava has the “same workout” starting at 18:35 and with a duration of 42:38 min …
That kind of change seems to be a general Strava issue – at least, I have seen it with a number of different recording devices/platforms.
In that sense, I’d be happy to see only the original FIT data in i.icu, but I also have data from an Apple Watch (using Apple’s Training and WorkOutDoors) and also from my phone using different 3rd party apps… Should at least show up on the i.icu calendar and be used in the fitness/fatique calculations;-)
All this data is already accumulated in Strava, that’s why I started there…
Maybe it’s, at least, as a workaround, as simple as relaxing to an “start-time difference < 5 min” setting?
I have relaxed the “same start time” check to within 5 mins as you suggest. There is also a check on duration which is 5% and sometimes also distance at 5%.
Not really a confirmation – but today the Dropbox file automatically replaced the Strava data.
But for that ride Strava also did not mingle the data (much;-)…
I assume it’s gonna work, the 5 min should be sufficient – thank you for the quick support/fix!
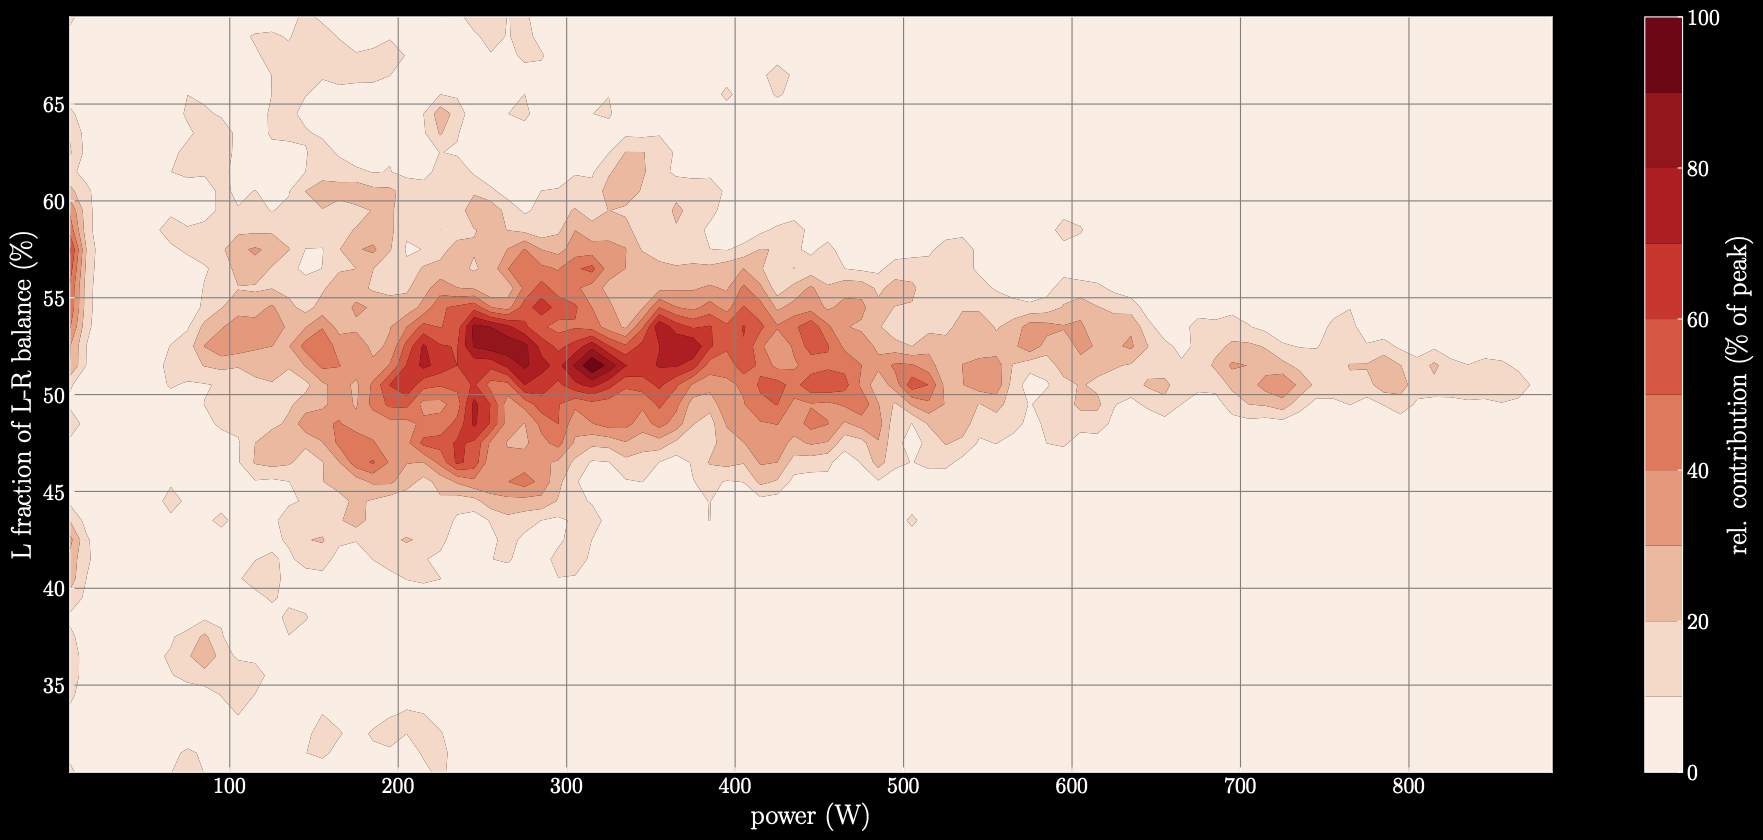
@david , is this “histogram instead of scatter” plot reasonably possible (with the toolkit you are using)?
Looking at the balance data, again and again I would like to see this…
Alternatively, would it be possible to download the plot data as csv/etc.? Then I could do this in a few lines of Python, I guess…
(Should probably learn to read fit files:-()
Okay, as this did not seem to happen in i.icu yet I went ahead and created a workaround
Maybe someone could implement this as a Javascript extension chart for the i.icu Activity power page?
I would be happy to advise and help fine tuning the output, but unfortunately I don;t have time to get into the javascript and display details to be used (t)here;-)
I created a (standalone) Python script to retrieve power and L/R data for an i.icu activity, create a 2d-histogram of this, and plot it as a contour plot.