On that note, it would be very useful if EF could be plotted on the find intervals page:
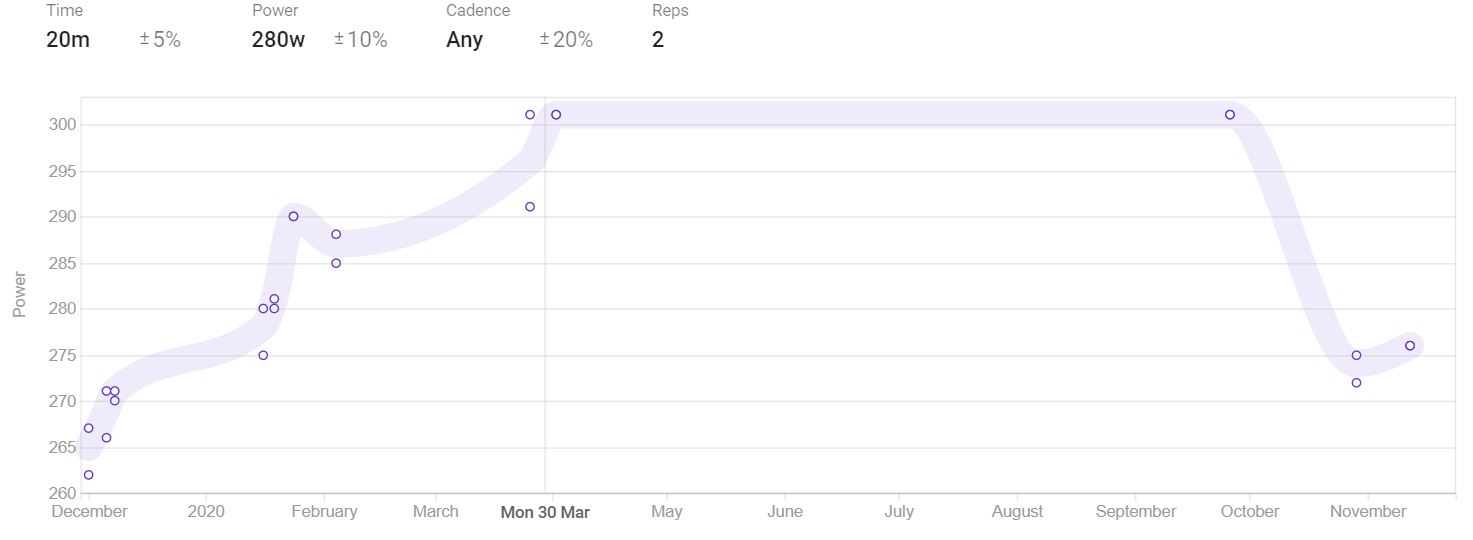
So intead of power on the y-axis, there would be EF and the filters can be used as they are now to filter only similar intervals. This way, very specific efficiency can be monitored.
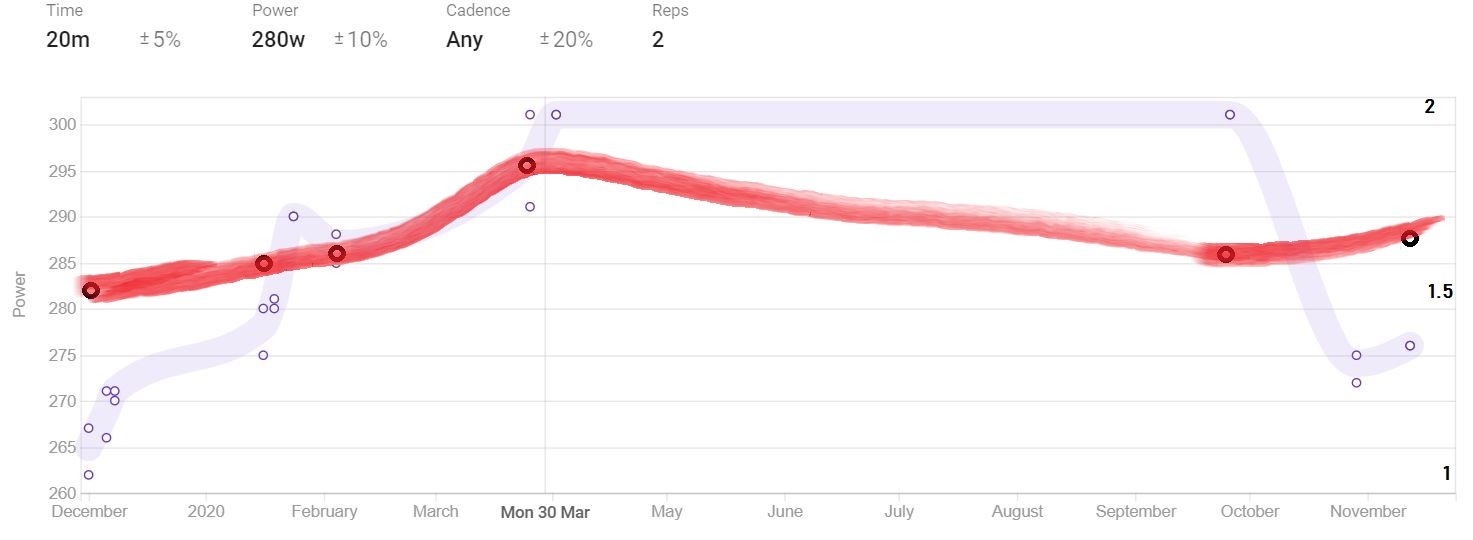
I drew an ugly illustration in paint to show the concept. One can see how over last winter, SS/Threshold intervals got more and more efficient. Now, for comparison, my form has dropped.