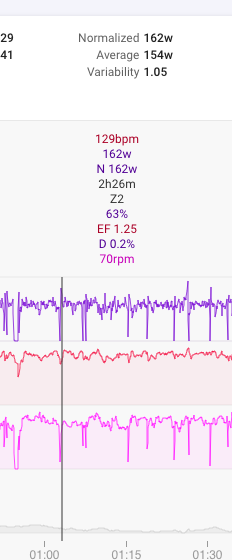
I’ve just noticed that the Average Power is the same as Normalised Power on the activities pages as per attached
I get that often on ERG mode training rides - your curve there doesn’t look like an ERG mode ride, but is it not just by coincidence that for that particular interval, average power was indeed equal to normalized power? Or do you see that everywhere, because I don’t…
Sorry, I should have made it clear. The figures on the graphs are for the whole ride not an interval. It was also an outside ride
1 Like
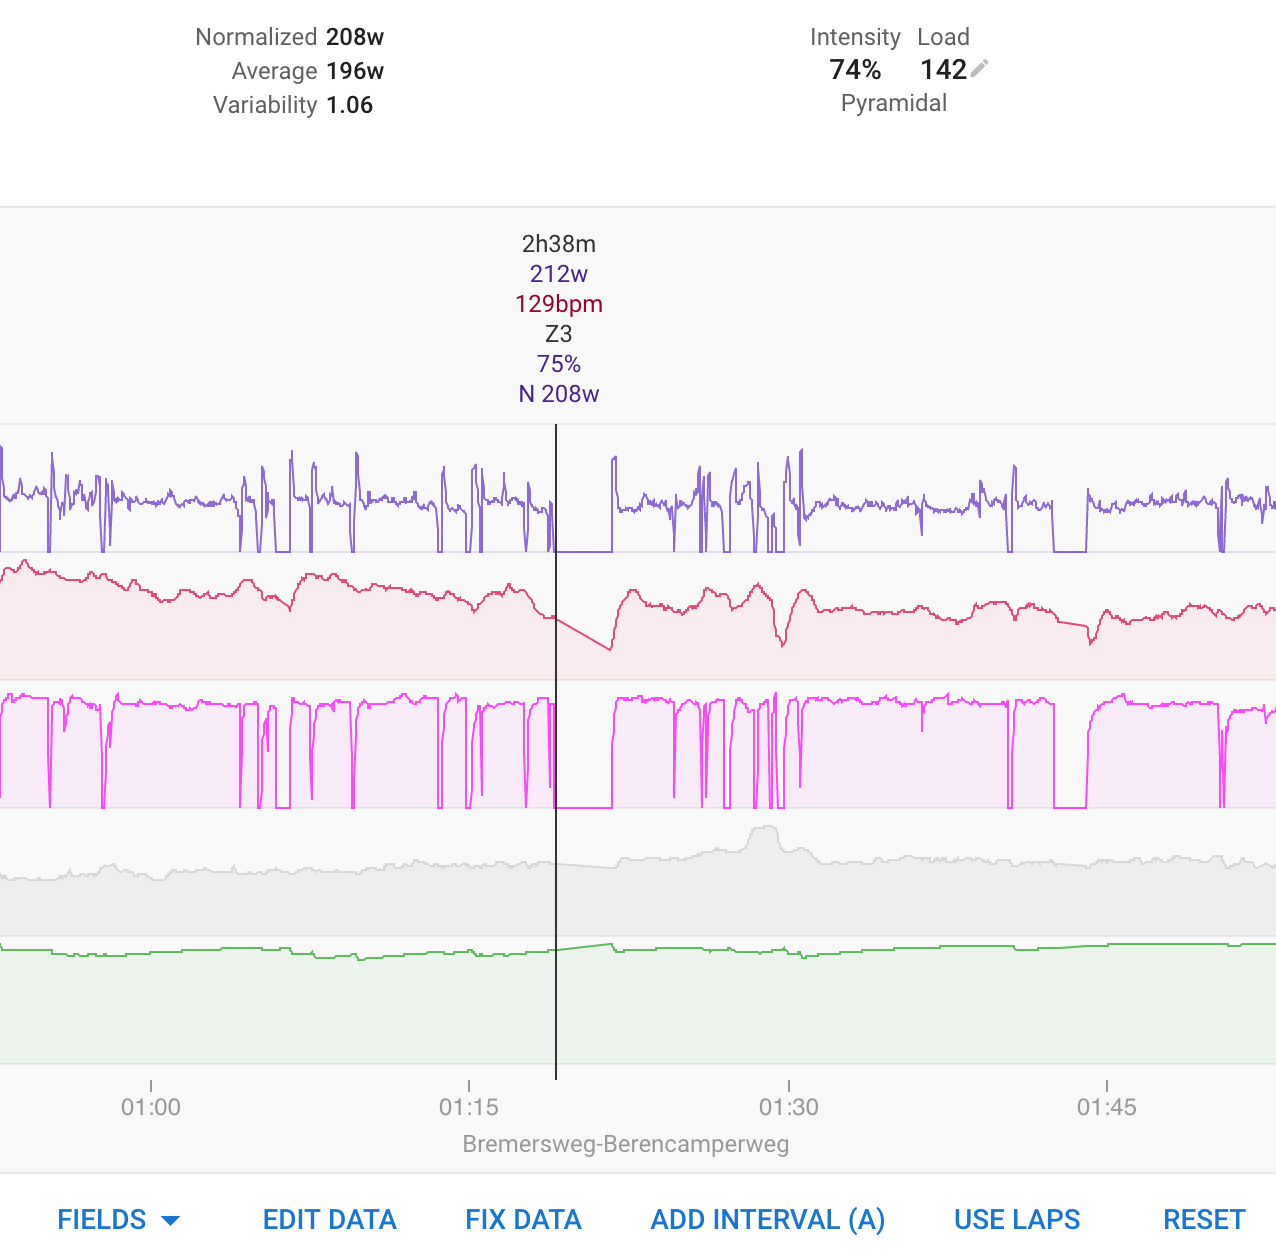
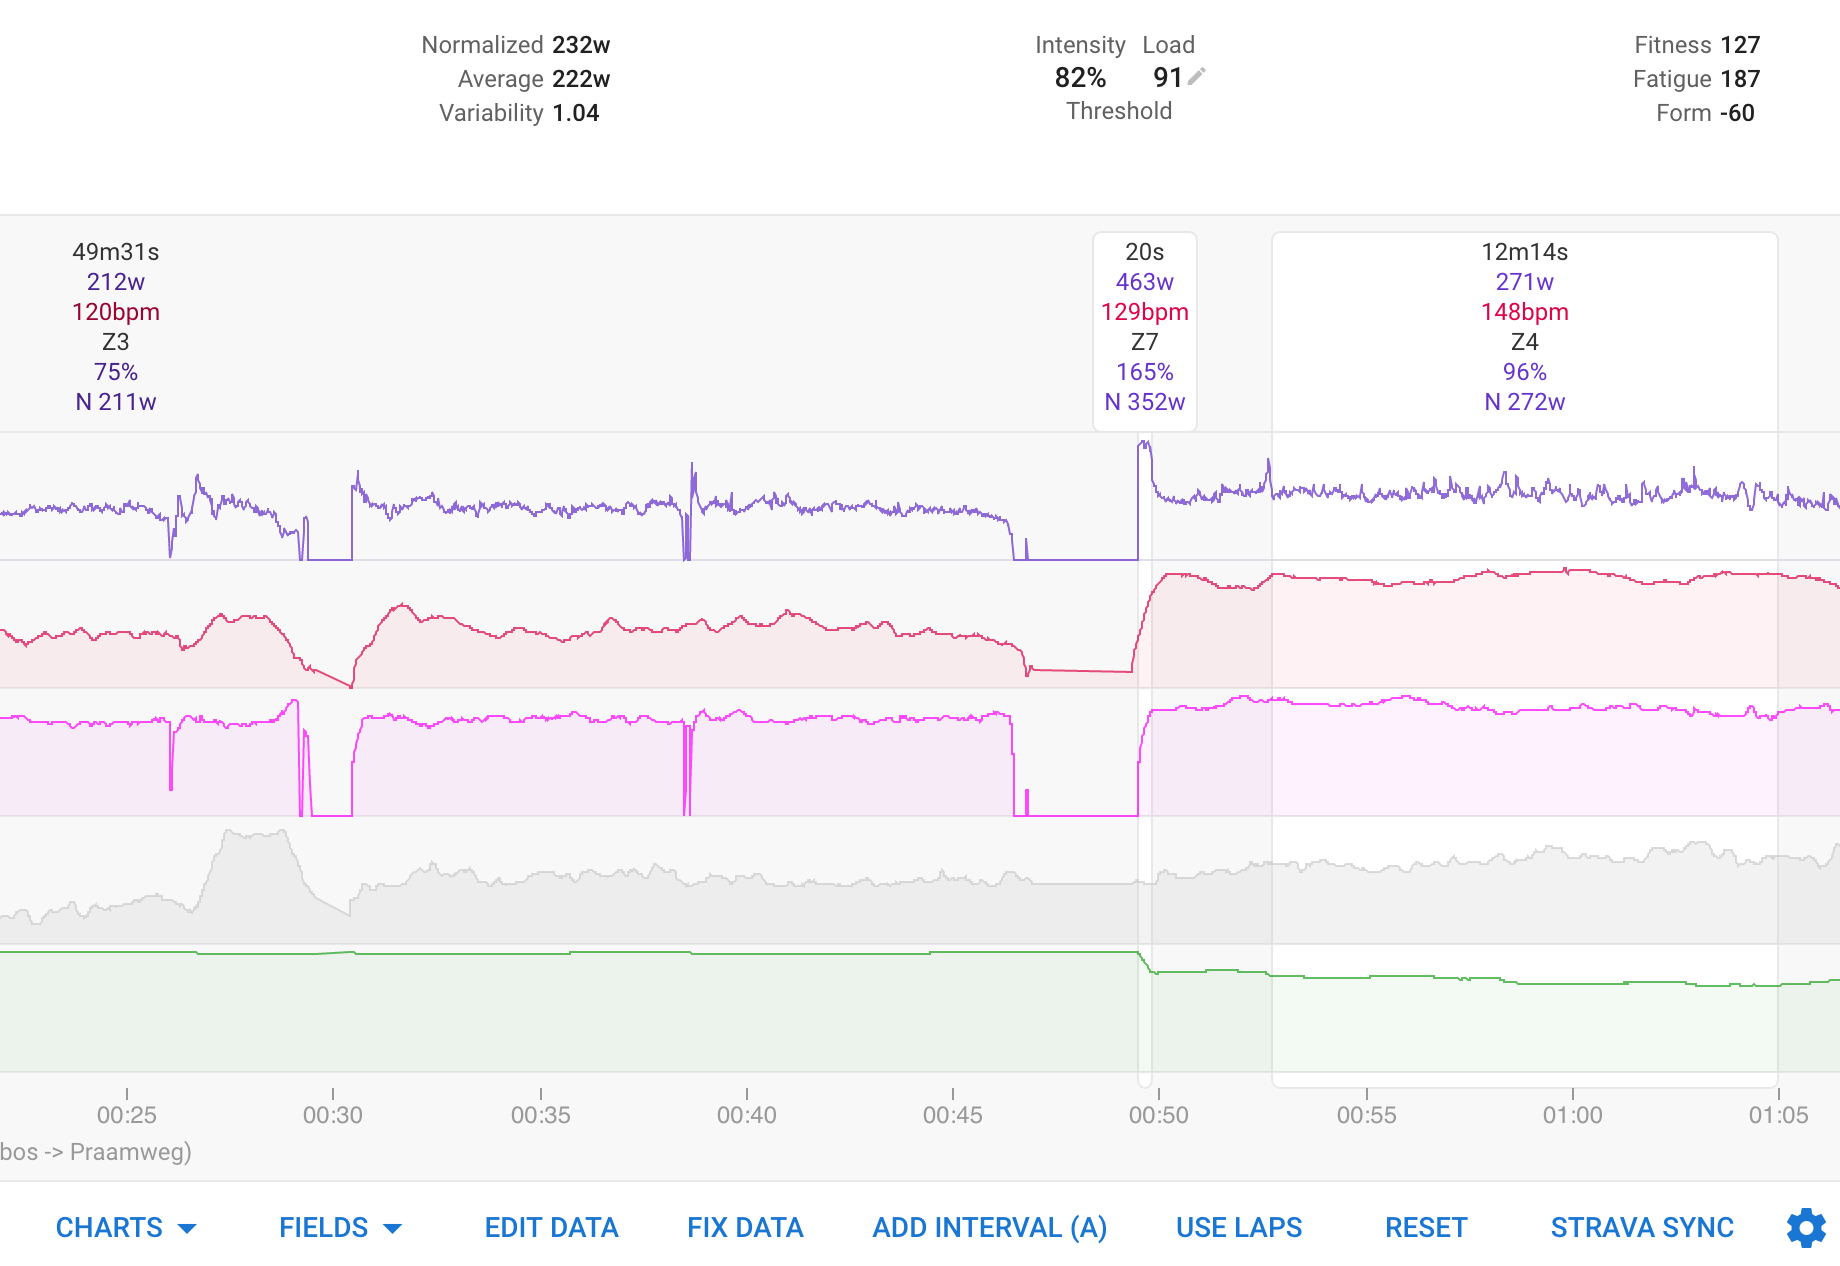
My bad. But, this happens on all your rides? As you can see, I have an outdoor ride without intervals (detected) and one with intervals. If no intervals are detected, the numbers are the same.
I may still miss your point in case though…
I’ve had a look at a few rides and the Normalised Power always seems to match up with the figures at the top of the page, it is the average power that varies from them - possibly something to do with the difference between Moving & Elapsed time perhaps?
Could be - I look at the same ride on Garmin (207/212), Strava (205/210) and Xert (200/210) and I get three different results, whereas from Xert I’m certain it calculates average power taken from the elapsed time, not the moving time. But even on intervals.icu (204/215), the data taken from Strava deviates by a (few) Watt(s) on the averages.
Could you pls msg me a link to that activity. Tx.
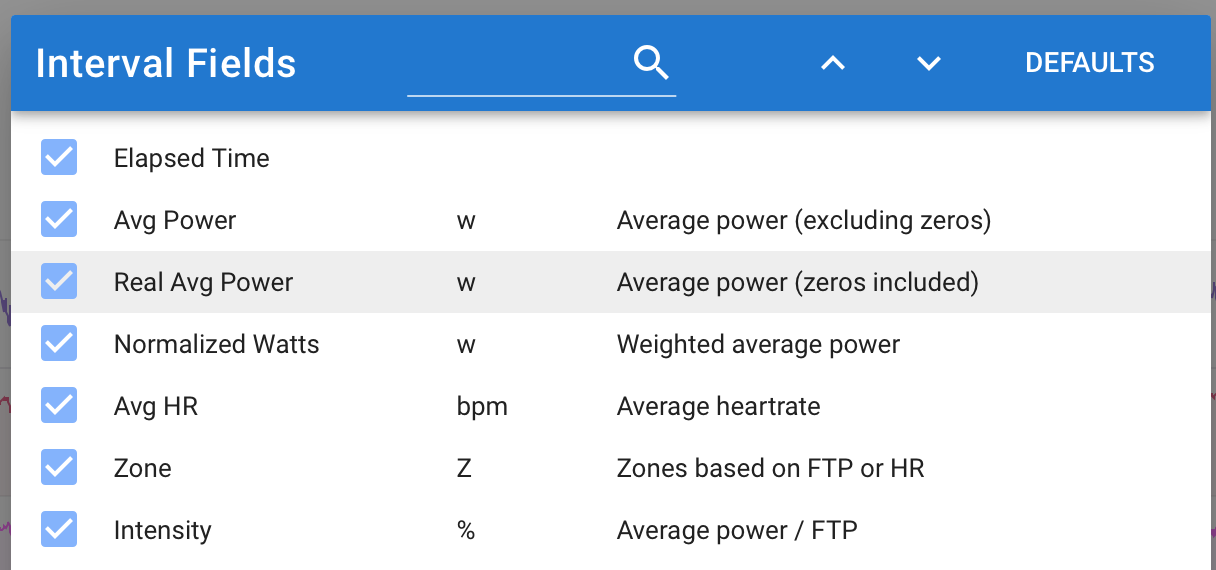
I figured it out. The average power for intervals is calculated excluding zeros because generally zeros in an interval is something up with the power meter. This doesn’t work out so well when no intervals are found and the whole ride is classed as “recovery”.
You can add “Real avg power” to get the average with zeros included. But normally the default avg is ok.
The average for the whole ride is a little higher I think because it has excluded that stop around 1h37.
Thanks David that’s great