Can anyone help me understand why (it seems) that intervals is displaying two different eFTP figures for me?
I use the eFTP trend graph on the progress page to show me my current eFTP

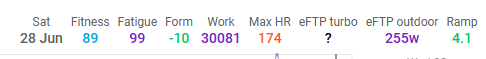
I have this set to show me my indoor FTP (as my turbo reads higher than my road bike power meter) separate from my outdoor FTP (I’m getting intervals to calculate using the “not virtual ride” vs “virtual ride” filter). The image above shows me the current readings (I’ve not ridden indoors for the summer, hence the lack of current indoor eFTP.
It’s showing a current outdoor eFTP of 255.
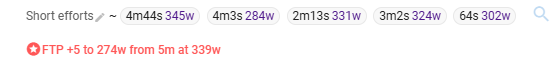
Recently I did some short efforts, and intervals rewarded me with a message saying it had bumped my eFTP up to 274.
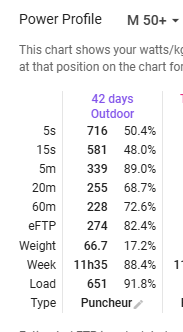
and 274 is what shows in my Power Profile
I’m not that bothered by knowing which is “correct” (I’d rather work off the lower figure, which feels as though it is giving me perfectly suitable training zones; I’m managing my training sessions and peaking ok for events) but I’m also curious about the difference and whether I’m just interpreting the figures wrongly and whether at some mythical point in the future I should lift up my zones. Can anyone help me make sense of this?