Decoupling as calculated in the “Timeline” and in “Power Tabs” is inconsistent (not the same).
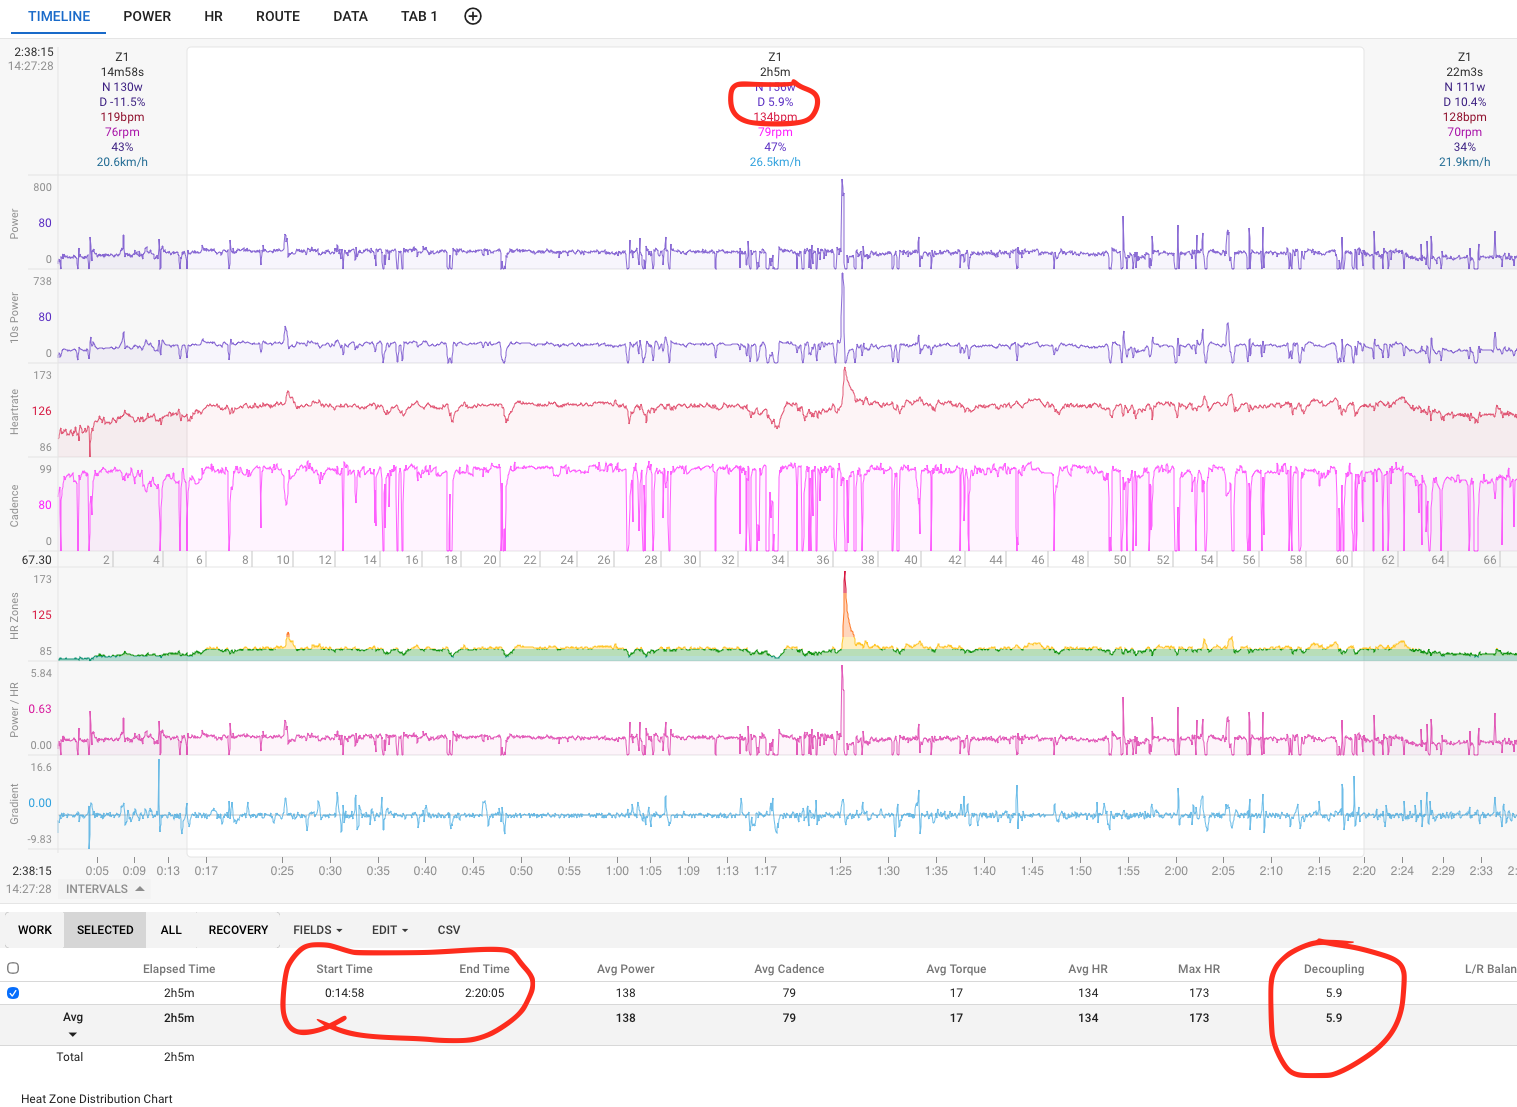
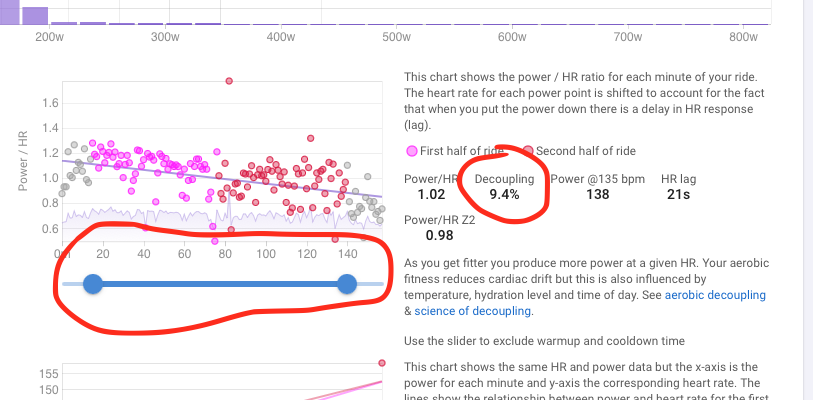
I want to calculate decoupling for a given workout interval (start: 15m, end: 140m). The decoupling calculated for the given interval at the “Timeline” tab (5.9% in the example) is not the same with the decoupling calculated at the “Power” tab after defining the desired interval with the slider.
Am I missing something?
Hey Alexandros - they will always be different and yes, they are calculating the same index (decoupling), but they are utilizing different datasets. The timeline decoupling figure will be the calculated value from the (effectively continuous) dataset that is the power/HR/time series from the .fit file uploaded. Given the devices used (PM, HR monitor, etc.) gather and transmit their measured data up to ~10 Hz (10x data points/sec), you have (tens/hundreds of) thousands of individual data points to pull averages from. On the other hand, the Power tab decoupling figure is the calculated value from the dataset comprised of the binned, 1-min average values of HR and power. This smooths the data considerably, and can skew values calculated from that data. It is a function of resolution. I would recommend using the Timeline tab figure.
1 Like
Thanks a lot, these clear things up.
However, the activity Decoupling measure is the one calculated in the Power tab always, so the GUI seems to trust this more. Also, if this is changed (e.g. with the slider) the decoupling value associated with the activity changes (e.g. as a column value in the activity list).
Also, the decoupling (Pw:HR) value associated with the same activity in other platforms (TrainingPeaks) matches the one calculated in the Power tab.
So I am really not quite sure which value to trust. I would like to trust the one of the timeline, since it is significantly lower  (5.9% vs. 9%) but hard data shows otherwise.