Thanks for all the great developments on intervals!
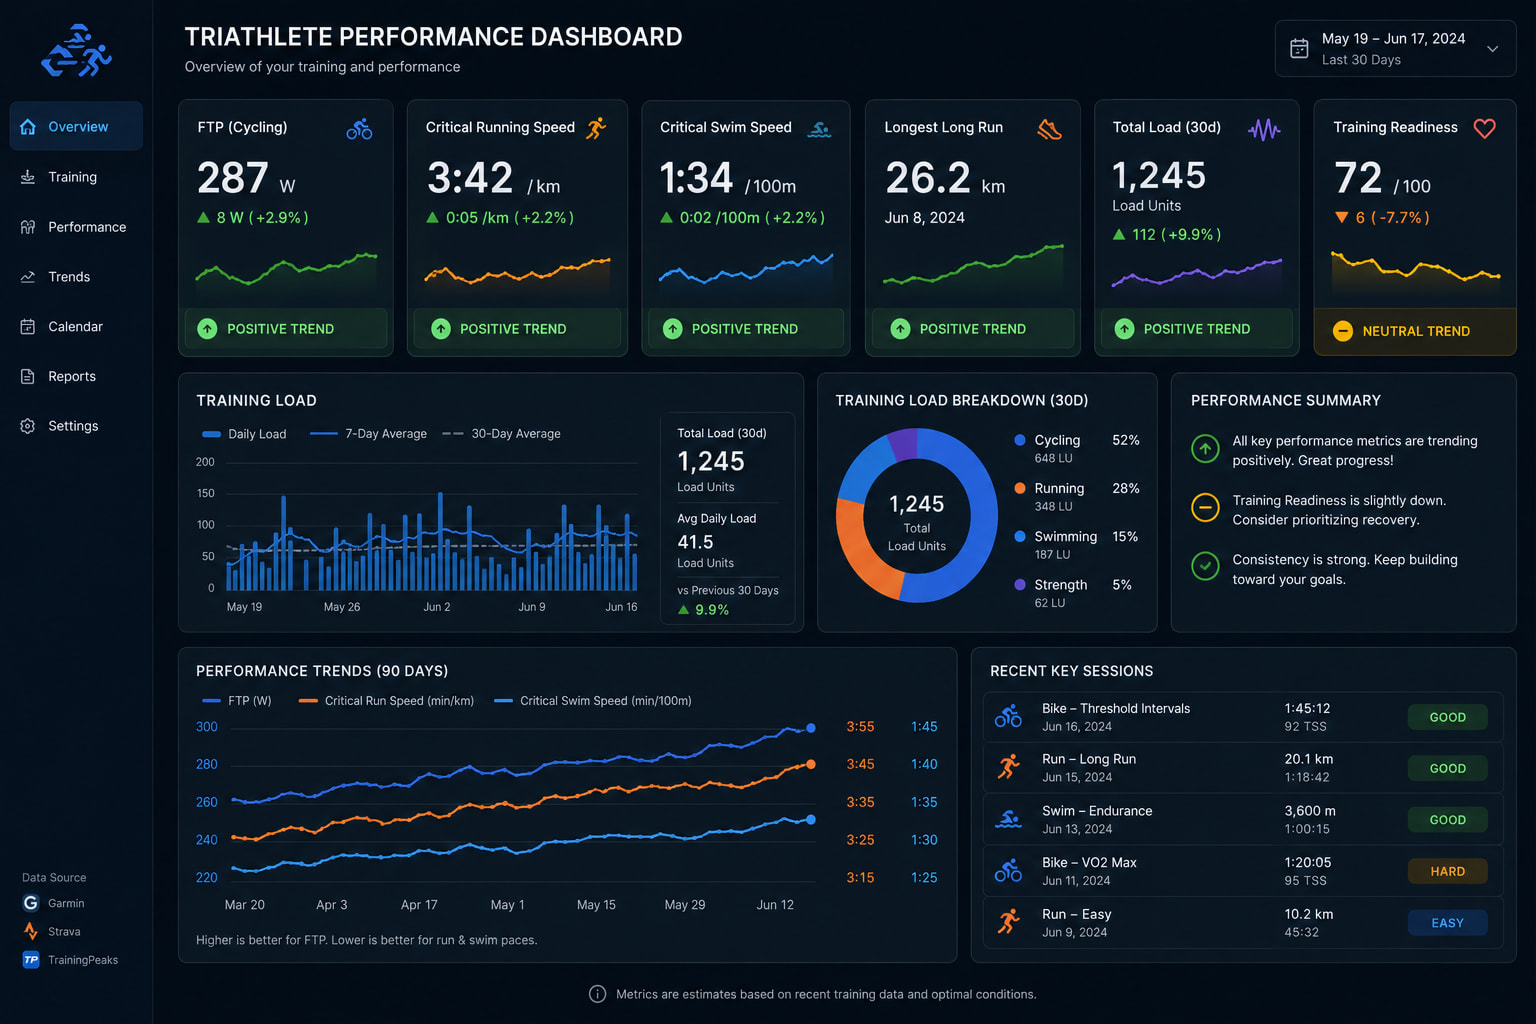
I find myself often thinking it would be handy with a overview page, dashboard-style, that displays a selectable set of KPIs. Example of KPIs could be the load metrics, ftp/critical speeds, 7d hours, readiness/restitution, current heat adaptation etc.
Most of the pages on intervals are either charts/table, calendar or totals, but nothing that gives a simple, customisable overview. All of the information is available on different pages, but would be nice to gather the most important things on a dashboard. And not needing to scroll or place cursor correctly on current week. The closest I have come to this currently is on the calendar (activities), but it doesnt quite cut it.
Anyone else thinking the same?
Made an illustration of the concept :