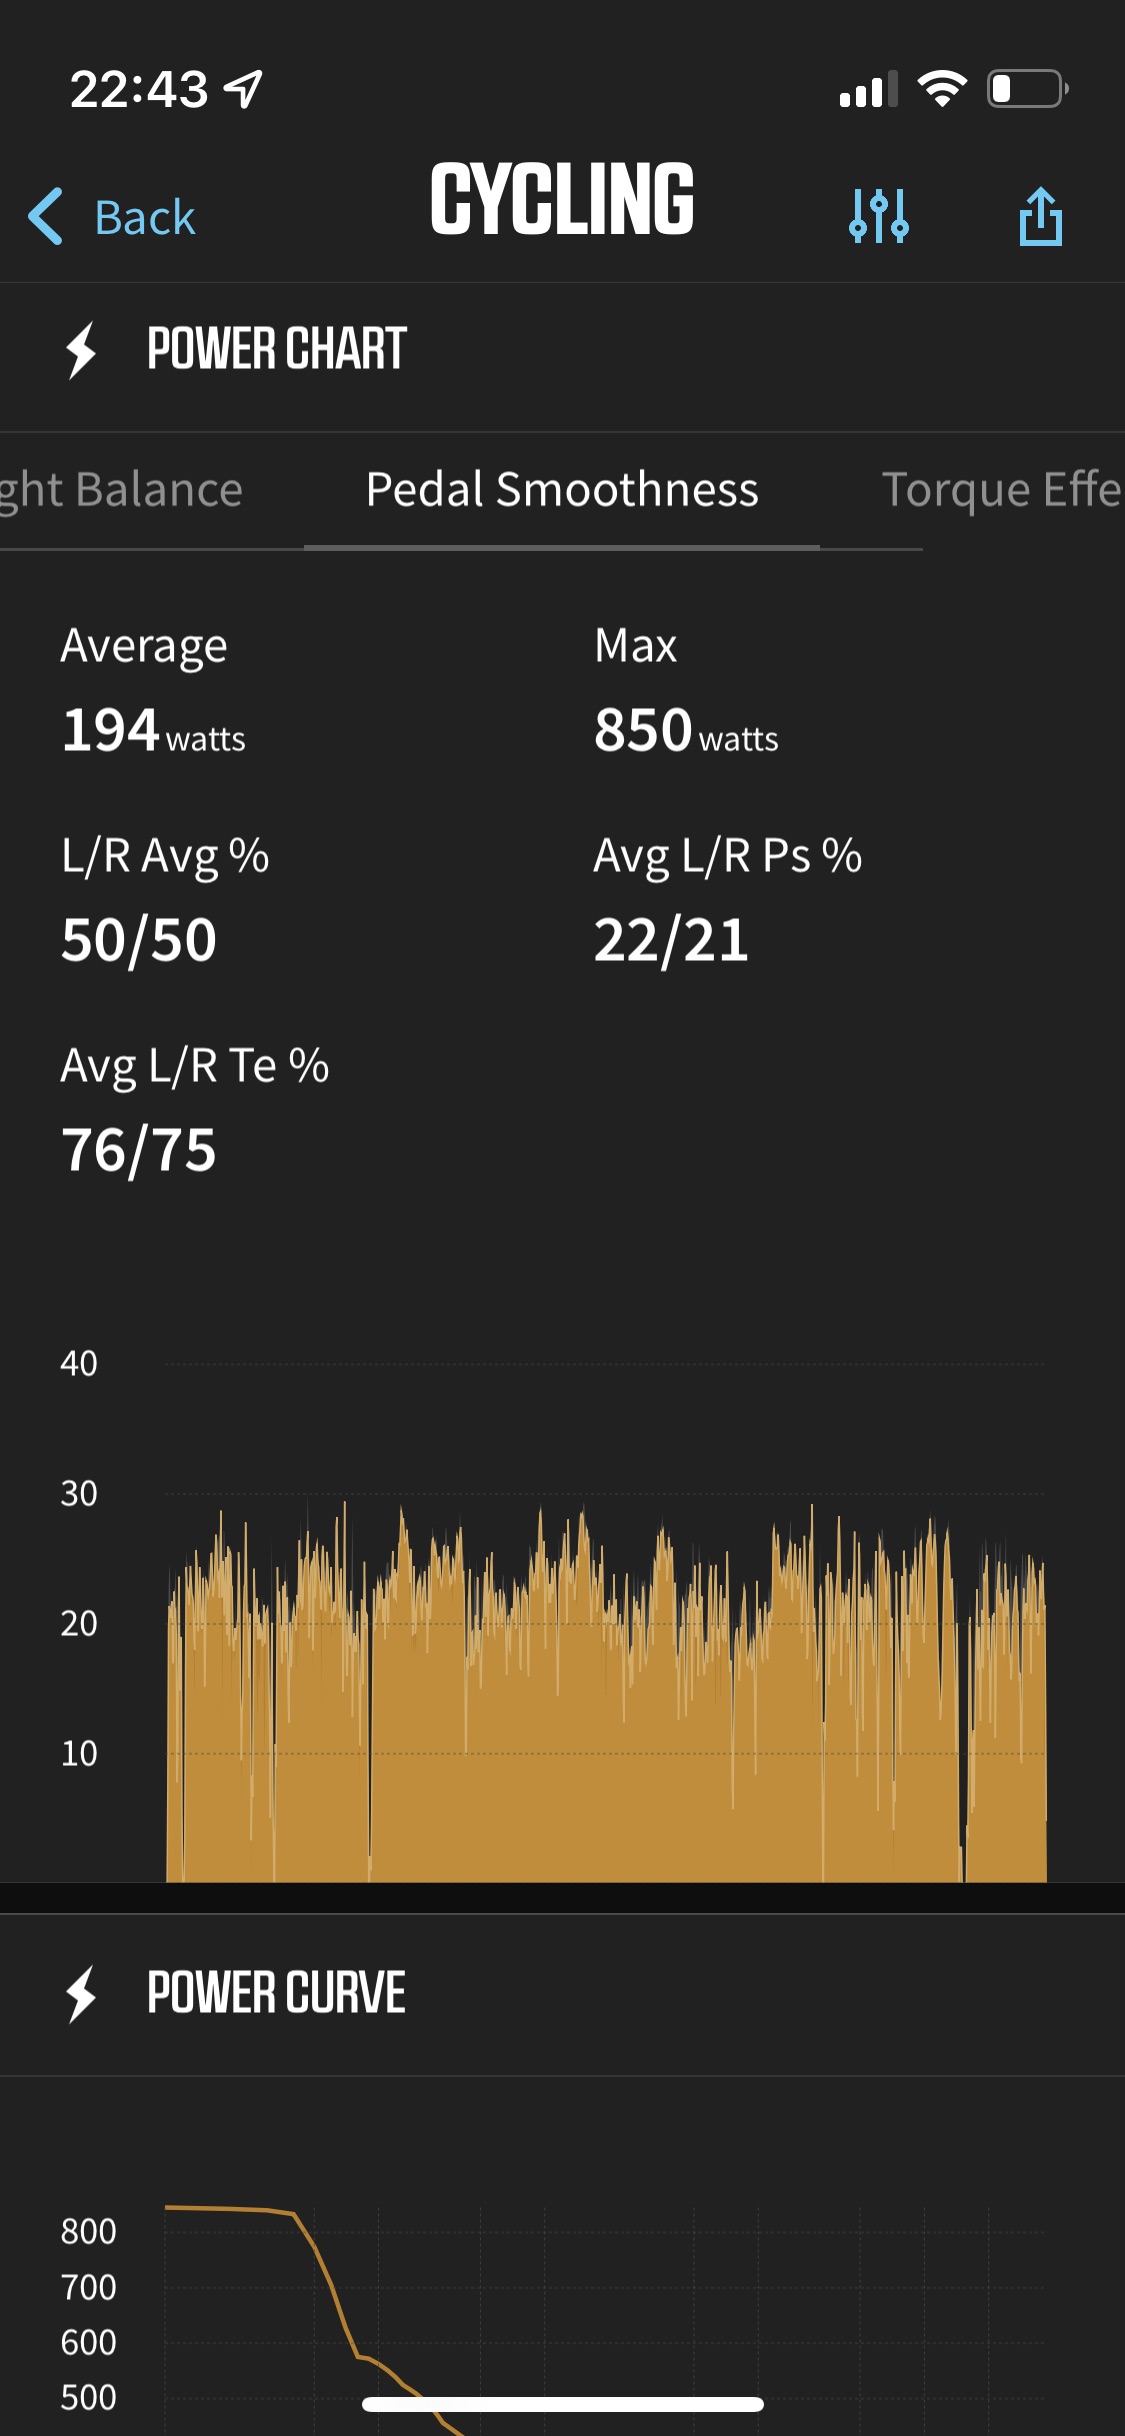
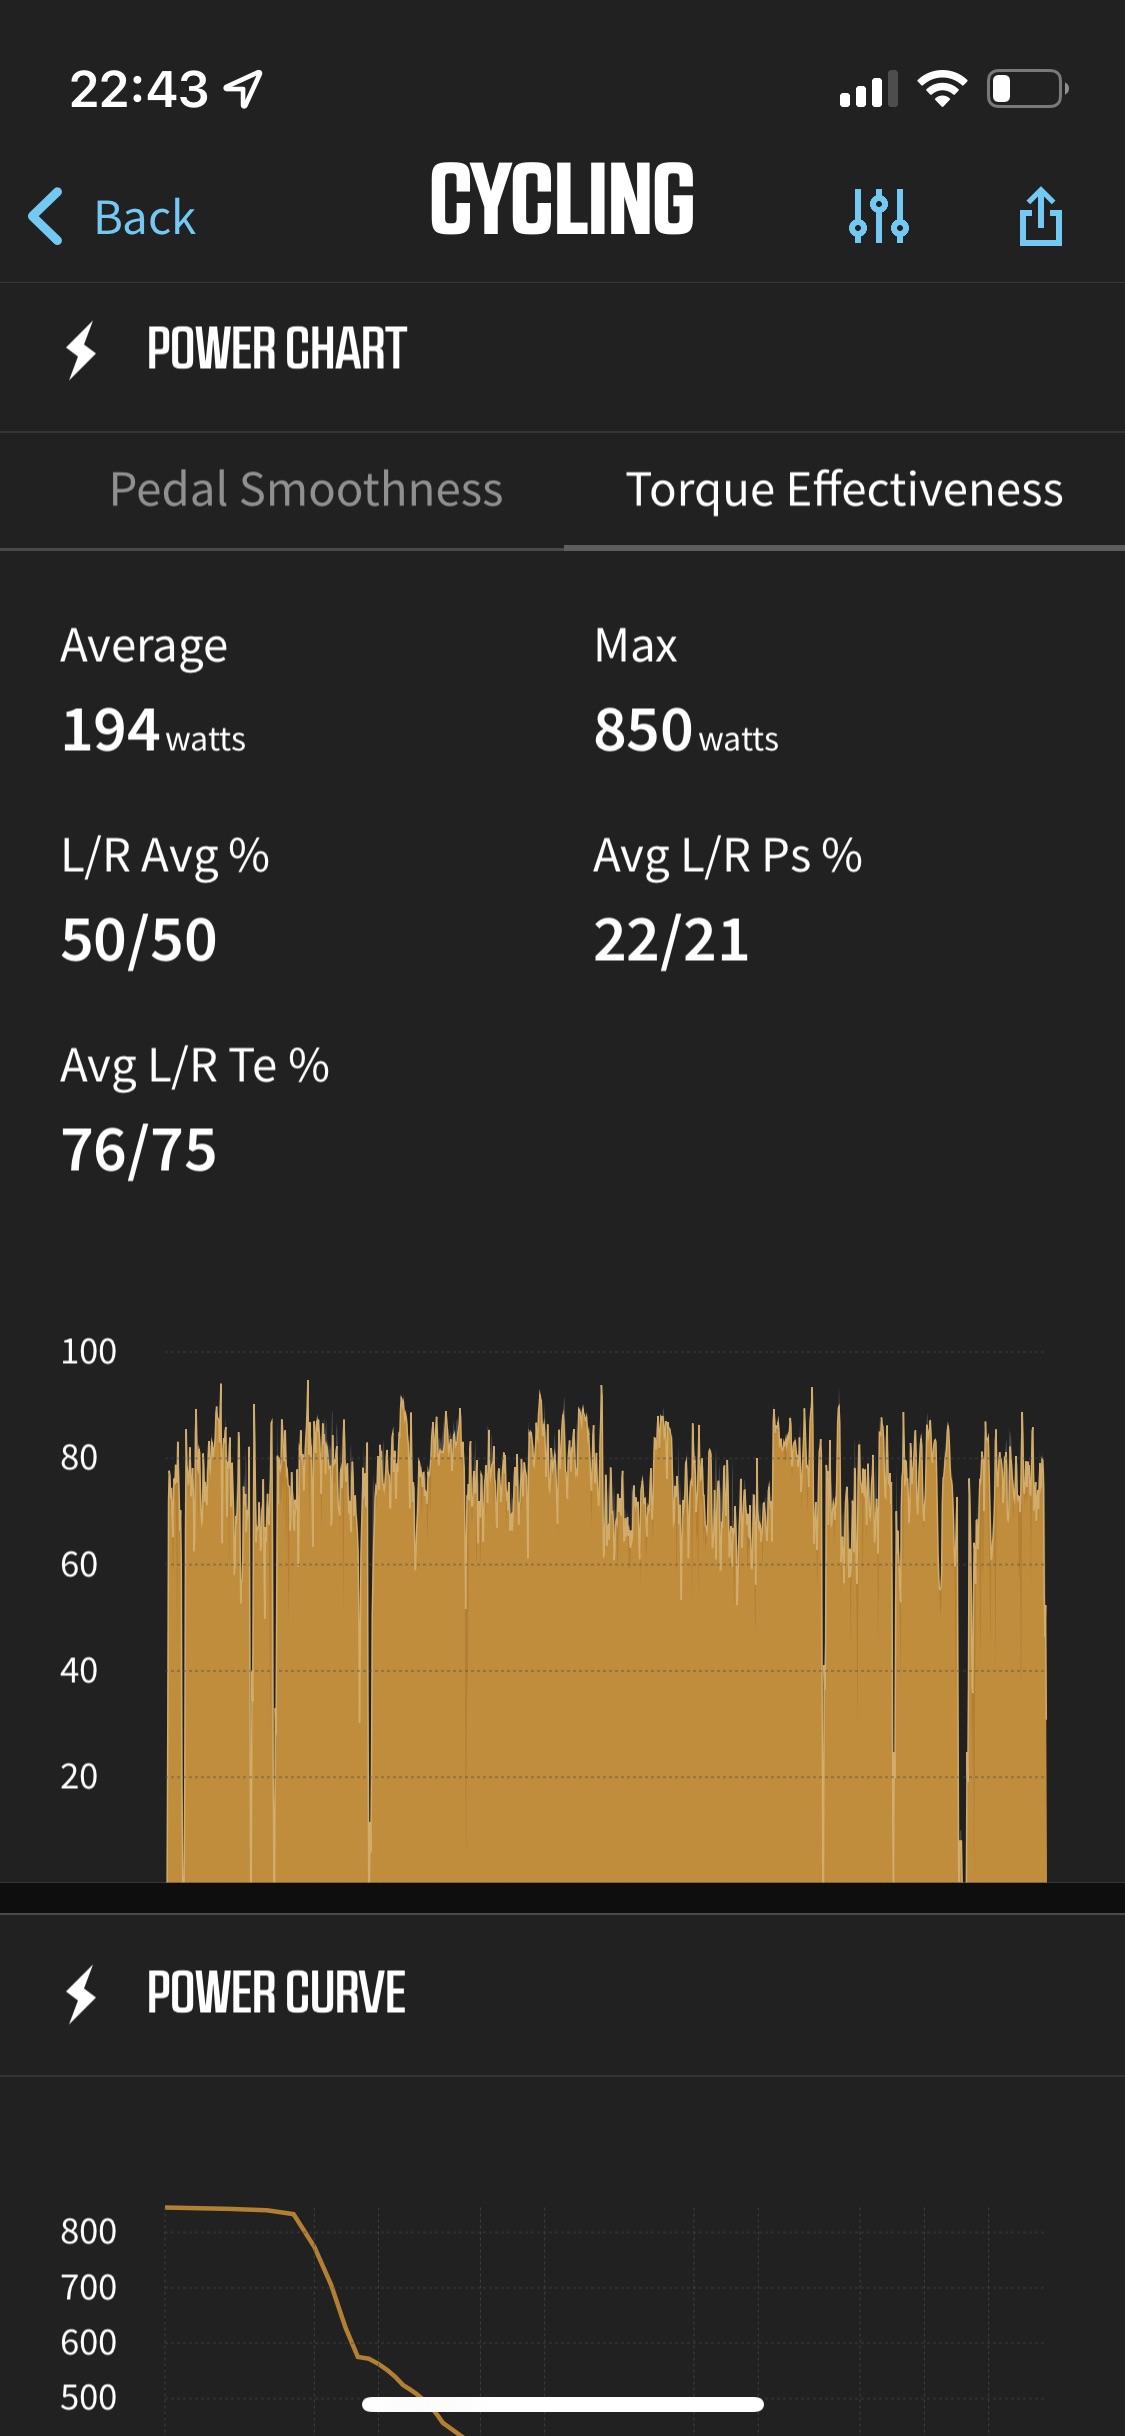
first of all thanks for this awesome site, just started two months ago but it is such a useful tool to track my training progress. I have just got my new power meter pedals with cycling dynamics support and wonder if you could add additional power charts for an activity to show pedal smoothness and torque effectiveness (over time in the overview and over watts in the power tab) in addition to balance. Both values were logged by my Wahoo Bolt and Assioma Duo and are present in the Fit file uploaded to intervals.icu. Here is an example record from the file:
@david , it would truly be great to get pedal smoothness and torque effectiveness into the activity charts;-)
In my case also from Assiomas via a Wahoo Bolt… The ELEMNT app shows such graphs, but they are simply to small:-o
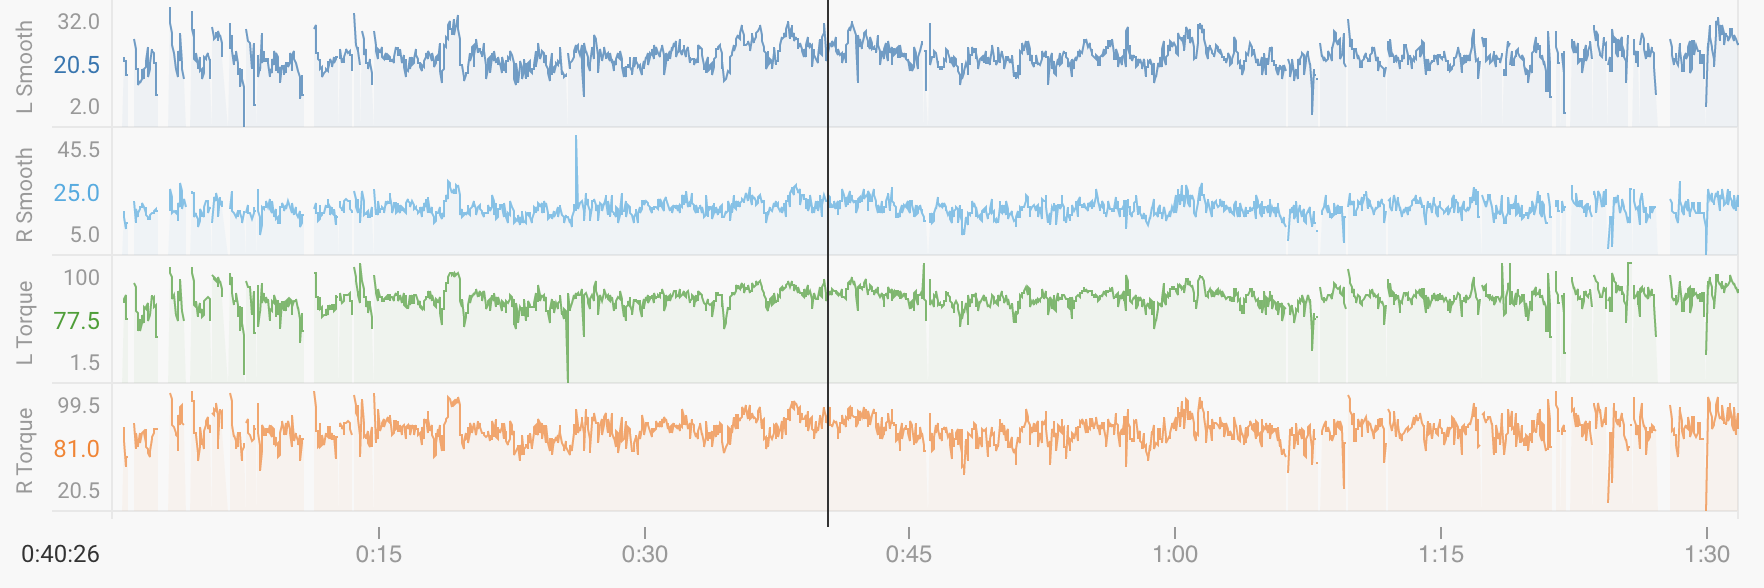
Ok I can see the data in the recent file (left_torque_effectiveness etc.). Would it be sufficient to just have those available as traces? Thats easy to do. Doing an XY plot like on Cycling dynamics is much more work and there is probably some lower hanging fruit on the todo list
Enabling plotting this data as traces, and seeing them on a large screen and visually correlated with the effort/power/etc., would definitely be a big step forward!
Maybe these advanced plots could go on your ToDo list at some appropriate priority;-)
I’ve also been thinking on how to easily access such more specific data, incl. even the L/R balance stuff, for advanced offline histogramming/plotting by myself … (guess I need to learn how to parse fit files in Python;-)
The charts and metrics are nice but I haven’t seen or read anything contributing to an improved pedalling technique. On the contrary, even simply trying to improve L/R balance results in performance loss.
As far as I know it can only be usefull when recovering from a leg injury impacting one leg only. Then a foolow-up of the recovery process can be done.
Maybe the future will bring more but for now, it has only been a marketing point.
Pedalling technique can be improved by working on the bike and with simple exercises at home (ankle dorsiflexion, hip flexors, gluteus…).
Another way to work on pedalling technique on the bike is to have the value of effectiveness and smoothness, using an intensity close to the first threshold or slightly above, a cadence of 75 rpm and looking for an effectiveness of over 80% and a smoothness of over 20%. Remember that round pedalling is biomechanically ineffective, the psoas is overused and is not beneficial for the cyclist.
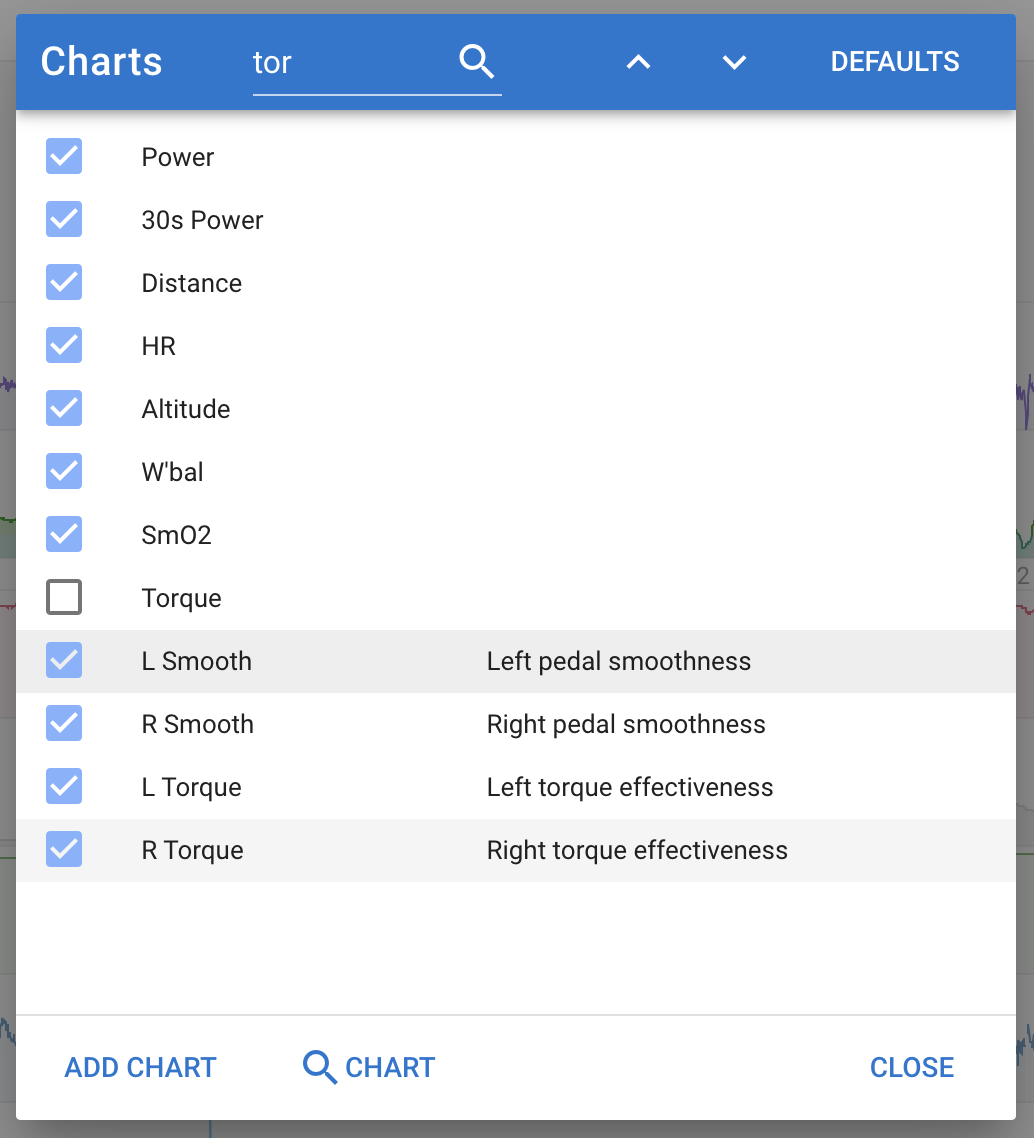
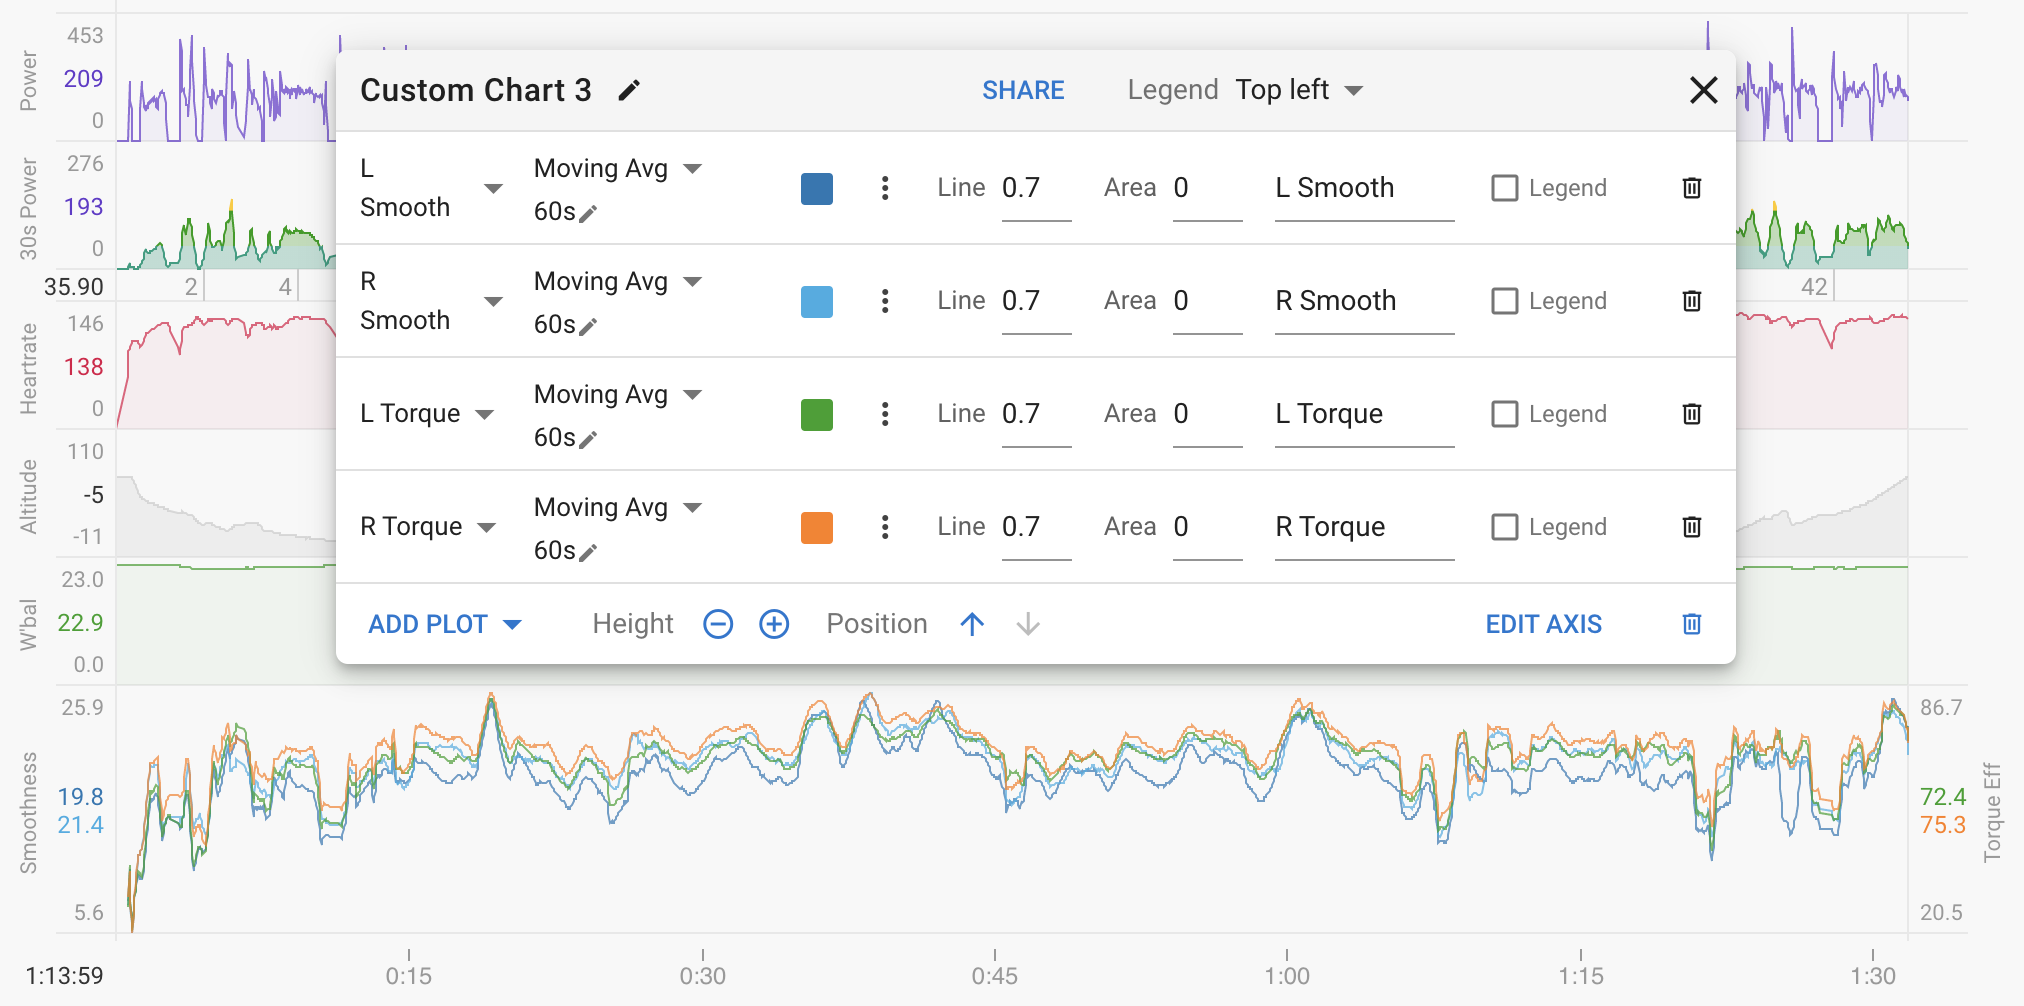
I added L/R pedal smoothness and L/R torque effectiveness. You need to do Actions → Reprocess file to add them to existing activities. Maybe someone can do something cool with a custom activity chart?
Ah ok, I found also that it can be helpful to print the available activities:
console.log(icu.activity.stream_types)
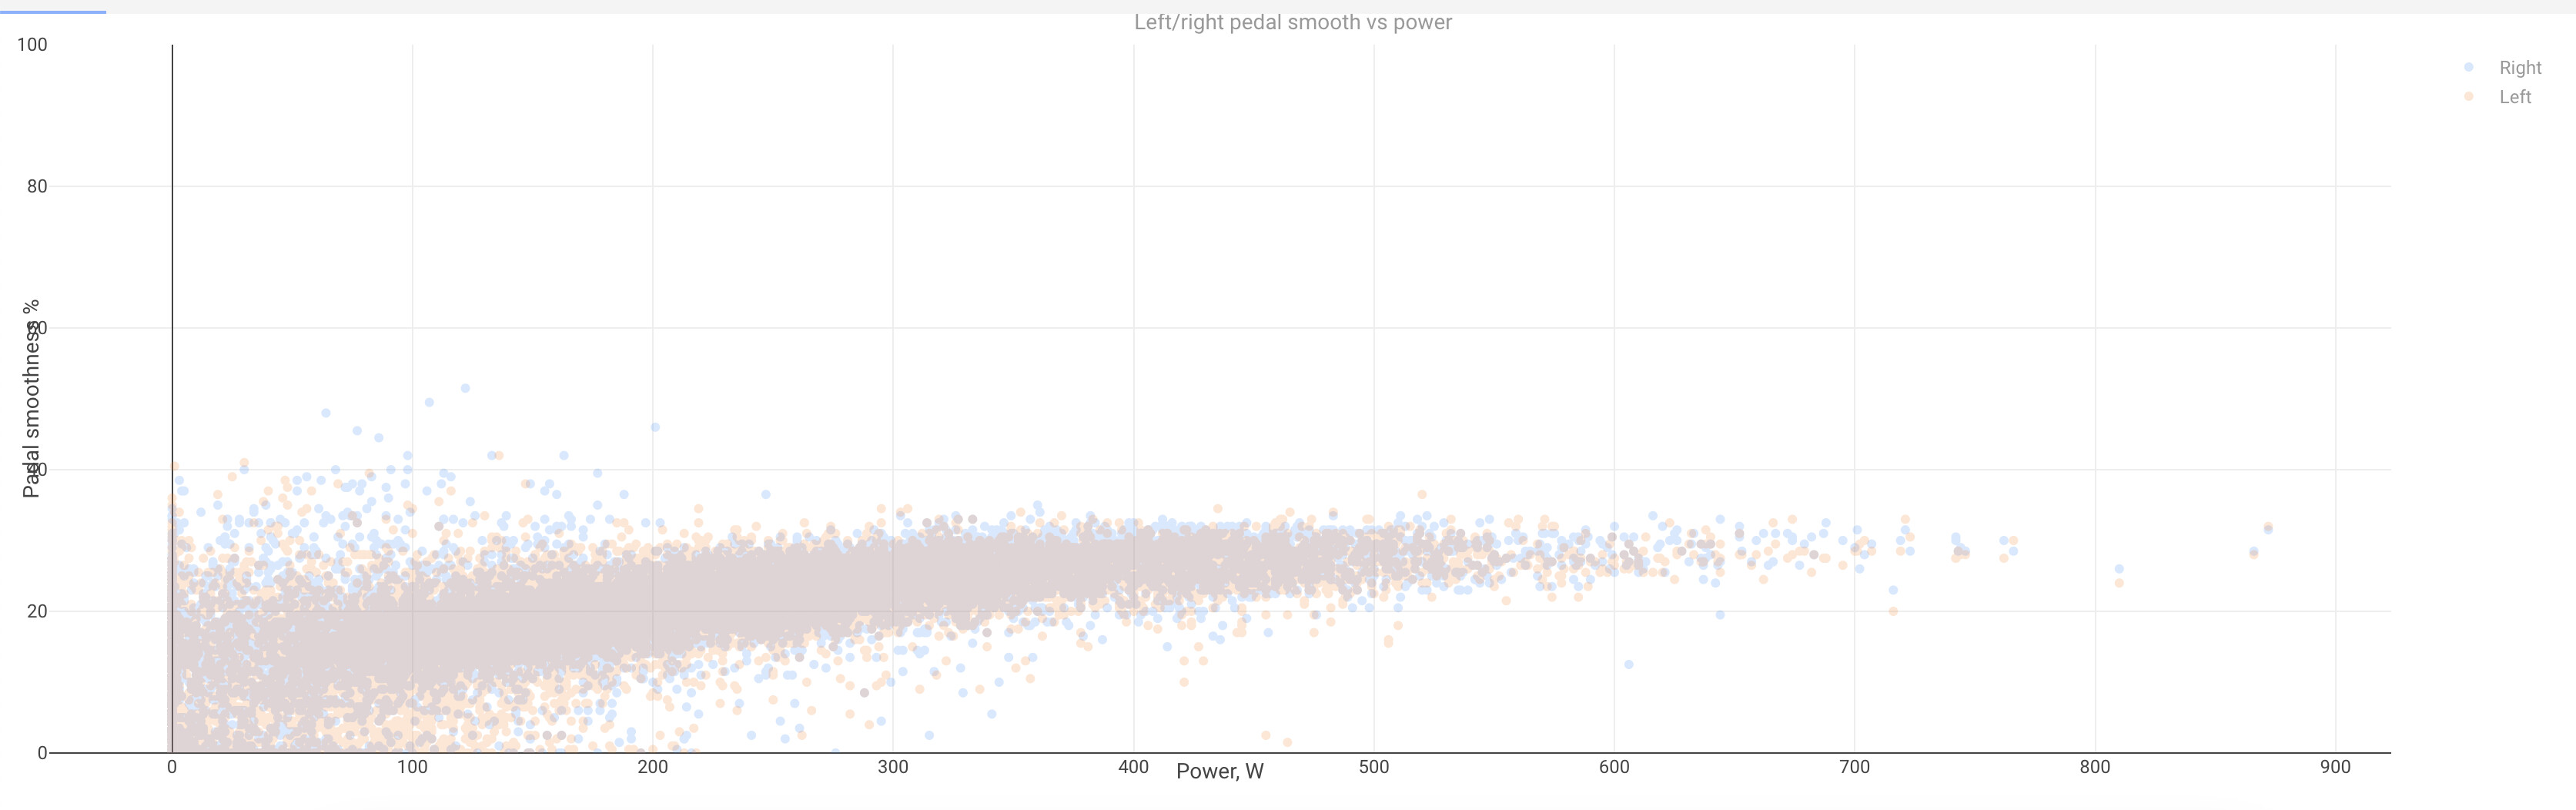
I created a left/right pedal smoothness plot, which is available to the activity charts.
It looks quite crappy, but I need a bit more of time for improving it.
I can’t get the data to show up in my activities. I checked the FIT files and there’s definitely data for “left torque effectiveness” a. “left pedal smoothness”. The charts are activated but don’t show up.
I’ve seen that mentioned before, but I’d say this should only be necessary for activities created before David added the feature. This one’s just from a couple of weeks ago.