I have custom field from Garmin Connect like rMSSD, Breath stage or HRV, how can I display it in Graphs?
I just learned how to do that myself, so take everything I say with a pinch of salt.
All details can be found in the thread VO2max for Cycling and not just running.
You first need to add the field to your activities, as described here.
Then you’ll be able to add a custom chart to the fitness page, as described in the last screenshot here.
I’m sure someone will correct me if I got something wrong ![]()
Sorry for the late reply, I wasn’t at my computer ![]() Not sure if we are thinking the same thing. I don’t want to create custom fields, I just need them to import from Garmin Connect. For example I have data like SDNN, rMSSD, or HRV from this app: Connect IQ Store | Free Watch Faces and Apps | Garmin
Not sure if we are thinking the same thing. I don’t want to create custom fields, I just need them to import from Garmin Connect. For example I have data like SDNN, rMSSD, or HRV from this app: Connect IQ Store | Free Watch Faces and Apps | Garmin
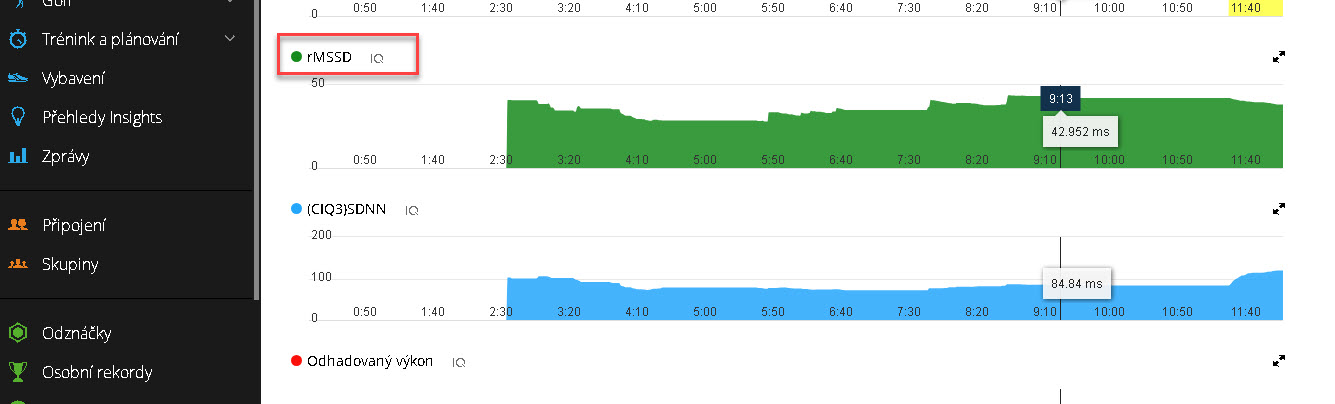
In Garmin Connect the data is displayed normally:
But in intervals.icu I don’t see anywhere, even if I look in the custom fields you wrote about.
Or is it that the fields don’t import themselves and I have to create an empty field first? I will create a custom field “SDNN”, but how do I connect and fill this field with data from Garmin Connect and display it in the graph?
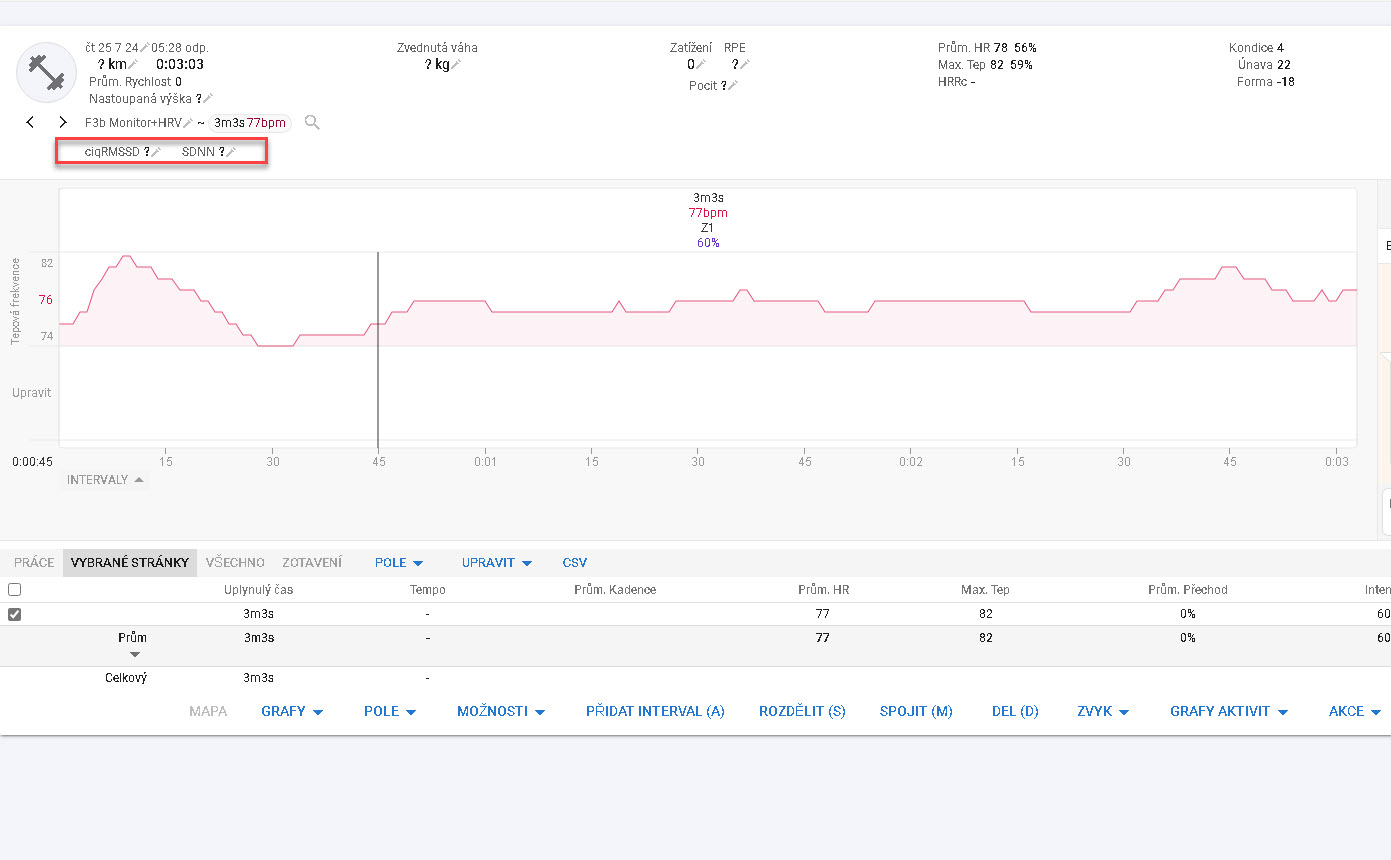
I’m not 100% sure I understand the question, but from the screenshot it seems that you already have the custom field, but it has no data.
To get the actual data from Garmin into an existing activity you need to choose the Reprocess option in the ACTIONS menu.
(not 100% sure about this either, never tried it:) If you need to create the field from scratch, you’ll have to write some code/script to get the actual values.
Data Streams, like yours (it is not a single value), must be configured with the Custom Streams option.
On the Activity page, Charts - Custom Streams - Add Stream. In the ´Record field´ dropdown, select the IQ dev field you want to plot.
You will need to configure a chart with this additional streams.
Search ´Custom Stream´ here on the forum for details.
MedTechCD, Thank You very much for your help, with the Custom Streams option it works now and I can import all the necessary data.
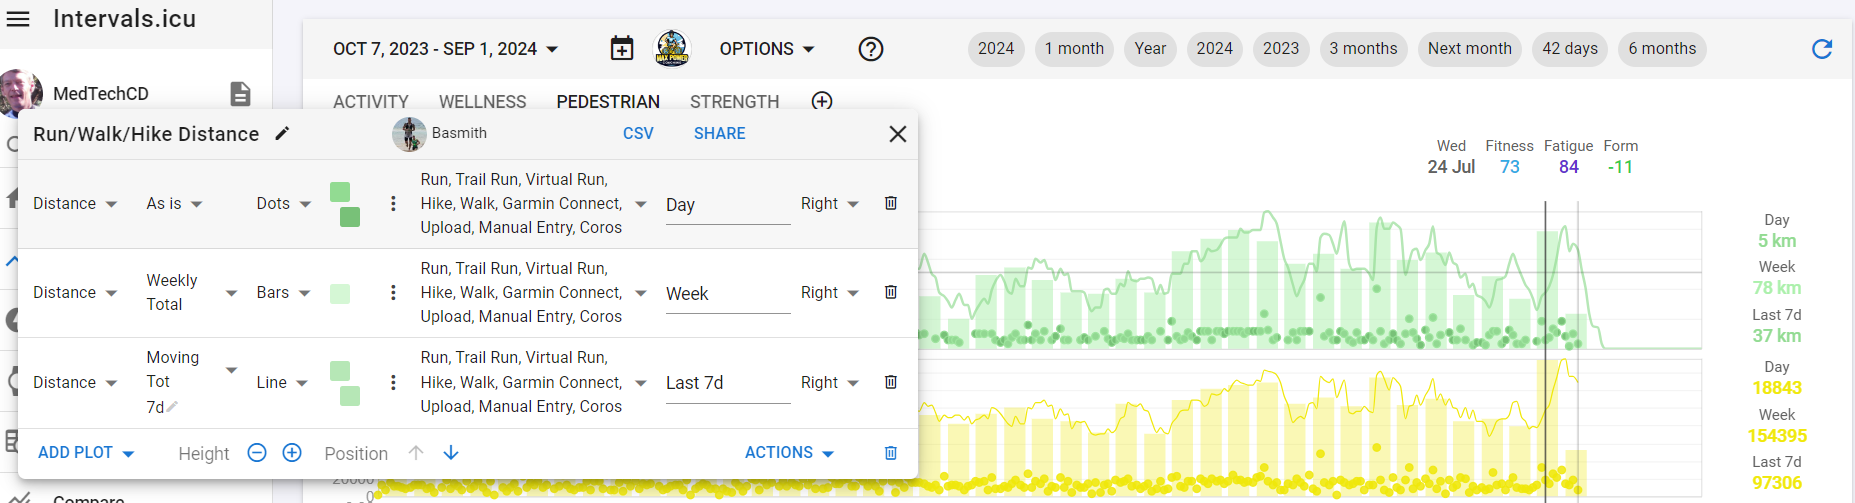
I still want to ask, how do I make a summary of a certain activity for a specific period in the graph? E.g. I want to display all running activities as the total distance I ran during each week. Possible? Thanks again.