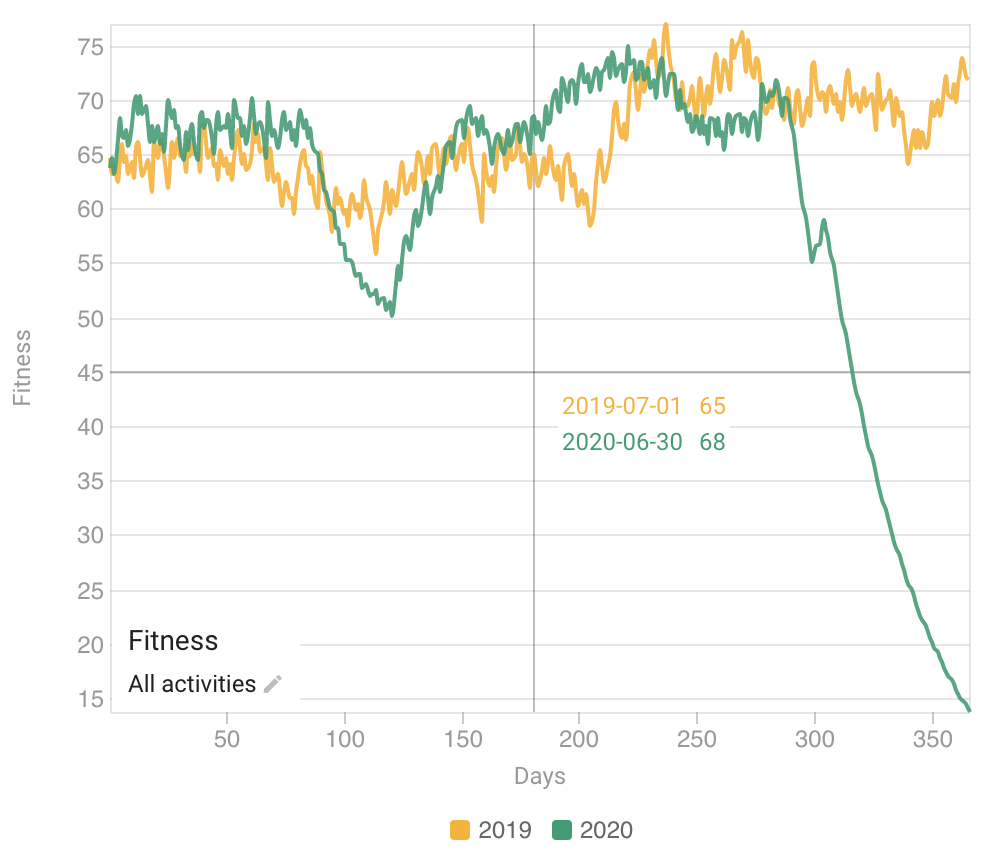
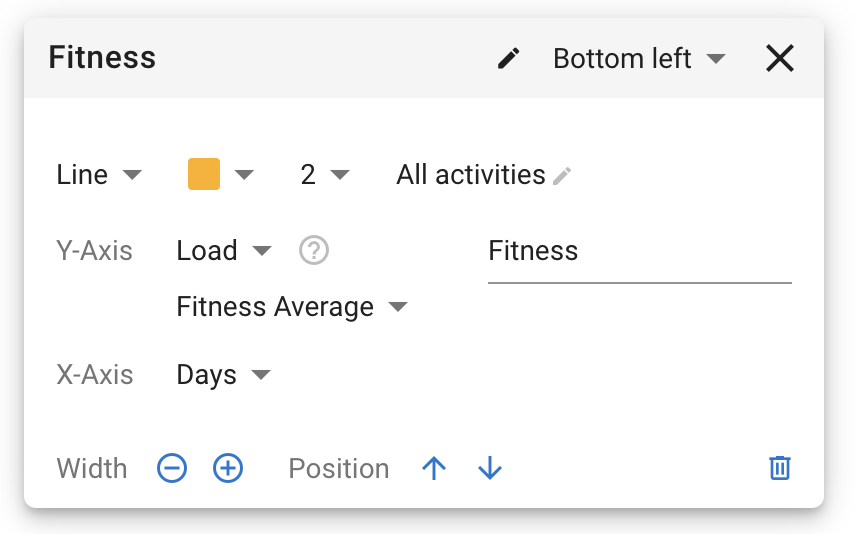
You can now add your own custom charts on the /compare page to go with the “Power vs HR chart”. Click the “Add Chart” button and choose one of the presets or “Custom”. You can compare time periods (e.g. this season vs last season) and/or athletes.
Great stuff: I was poking around and noticed there’s a “Cadence in Z2” field.
I assume not all possible fields are shown, but I’d be very interested in Cadence in Z4+ Where you’re guaranteed to pedal hard.
I was trying to recreate a chart of Torque vs Angular Velocity, but I’m guessing you don’t have the former from Strava and would need crank length to determine the latter.
this also made me think if you have a way to filter results by bike (or by power meter ID).
I love to be able to see indoor/outdoor power curves, would be interesting to dig deeper on the different bikes. In general torque is higher and cadence lower on MTB for instance.
A question, though: I was playing around with a cadence x days comparison and used a 42-day averaging to smooth out the graph. I noticed that the y-axis scale ran from 10 to 45. That seems very low [I typically ride at 75 - 95]. So: how is the 42-day averaging done to get the numbers that low?
The 42d averages and some of the others weren’t working properly on the compare page for things like cadence. Fixed now. Tx. Also fixed a “date out by 1 day” bug on the marker date display.
I have added that to the todo list. The stats that can be plotted currently are pre-generated for each activity so I need to add “cadence in zones” or similar for this.
Intervals.icu calculates crank torque from the cadence and power data.
Filter by bike is easy. One complication is that this is “per athlete” so if you compare multiple athletes or change athletes the filter will break. Unfortunately the bike type (road, MTB etc.) isn’t exposed by the Strava API.
On climbs or in general? Most people tend to have lower cadence on (steep) climbs, but it’s not a given. For example, I can go Z4 on my trainer and pedal at 100 rpm - this is also influencing HR btw, but that’s another issue. The same effort at 40 rpm will give another curve.
In theory there shouldn’t be a difference between power meters, but there may be a difference between in- and outdoors.
What I need to do for this is add tags to activities (road, MTB, power meter etc.) and then let people associate tags with bikes. Then I can do filtering on the tags which would make it cross athlete.
Was playing around and deleted all charts. Now I don’t seem to be able to repopulate new charts with data by selecting athletes or epochs. What am I not doing right?
Thanks, David. Reloading doesn’t work. One other thing I’ve noticed is that there is a “Compare Athletes” pulldown visible at the top of the window, which doesn’t work and which I can’t seem to get rid of. This problem is also only on the device where I deleted all the plots. The others show my data and I can select other athletes.
I have managed to reproduce the problem on my iPad (works on iPhone). The ok and cancel buttons for the athlete select dialog are “scrolled off” the bottom. You can get them back if you flick carefully right at the bottom. I am going to try fix this now.
Great addition to this site, especially when you are into data. Would it be possible to add a cumulative total as option in the charts ? I plot the days of a period and the distance or load, and would be nice to be able to compare cumulative totals.