Trying to plot a custum fitnesschart where I track my heartrate at a certain pace.
Like hr@pace 5:00 or hr@pace 4:30, so I can see my progression over time.
I get some results with a chart for “avg heartrate” and some pace filters put to specify a range, but it does not seem to work correctly. >> to few results. A single filter with “pace=” gives no results
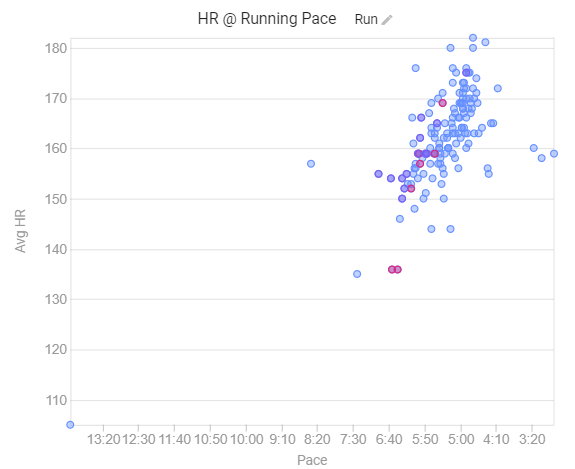
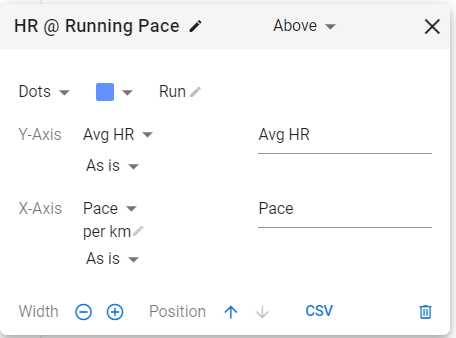
This is the heart rate at a given pace, similar to the Power vs. HR Plot that is inbuilt for cycling. You have to create a custom chart with “Avg HR” and “Pace” for that and also create a filter for running activities:
maybe playing with the setting helps to make it more readable but it gives a nice overview already.
A box plot or something like that would be awesome for given ranges of pace (maybe 5 or 10s/km would be a good resolution) because (at least my) running HR seems to differ more between activities at the same pace/intensity than for cycling
No, it is more like a point by point comparison. HR = x gives Pace = y and the values with the highest repeatability will show in the chart. Meaning that you will be able to verify from period to period, if your pace has increased for a certain HR.
If the dots for a more recent period are more oriented to the bottom right of the chart, you’re going faster at the same HR. That’s better performance.
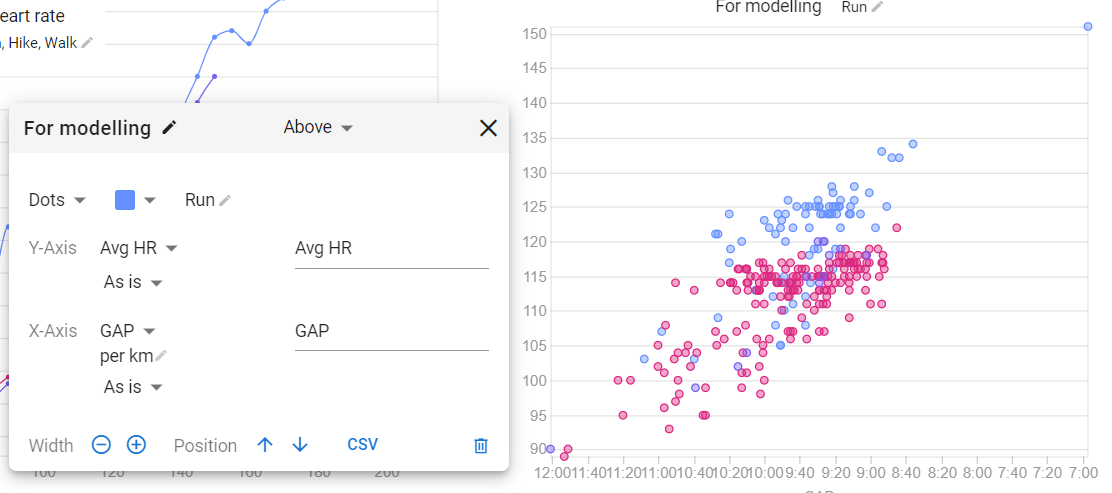
I have this chart for a while already but I used GAP iso Pace:
If you export as csv and model it in a spreadsheet to show the linear trend, you can distinct Pace at physiological breaking points to set your Pace zones in an individual way.
I wonder is there a way to effectively record smaller snippets of time and graph those.
Ideally, if you imagine taking 30second snapshots of every activity and measuring AVG HR and AVG pace for those. And then assigning those to HR to a pace bucket.
You could build a sort of violin plot which shows where your HR most frequently lies for a given pace bucket. Rather than just relying on the AVG HR of a session
So I’ve been playing a little bit with this. It’s not ideal, but I think I’m getting near something useful.
I’ve got 5 custom activity fields, which measure Median HR for fixed pace ranges.
For example, MED_HR_430_500 gets the median (average heart rate for 30 second periods where my average pace was 4:30->5:00 min/km).
I’ve got these for 5 different ranges:
SUB_400
400_430
430_500
500_530
530_600
ABOVE_600
These are obviously not very granular, but we’re limited to a single figure per activity field from what I can see.
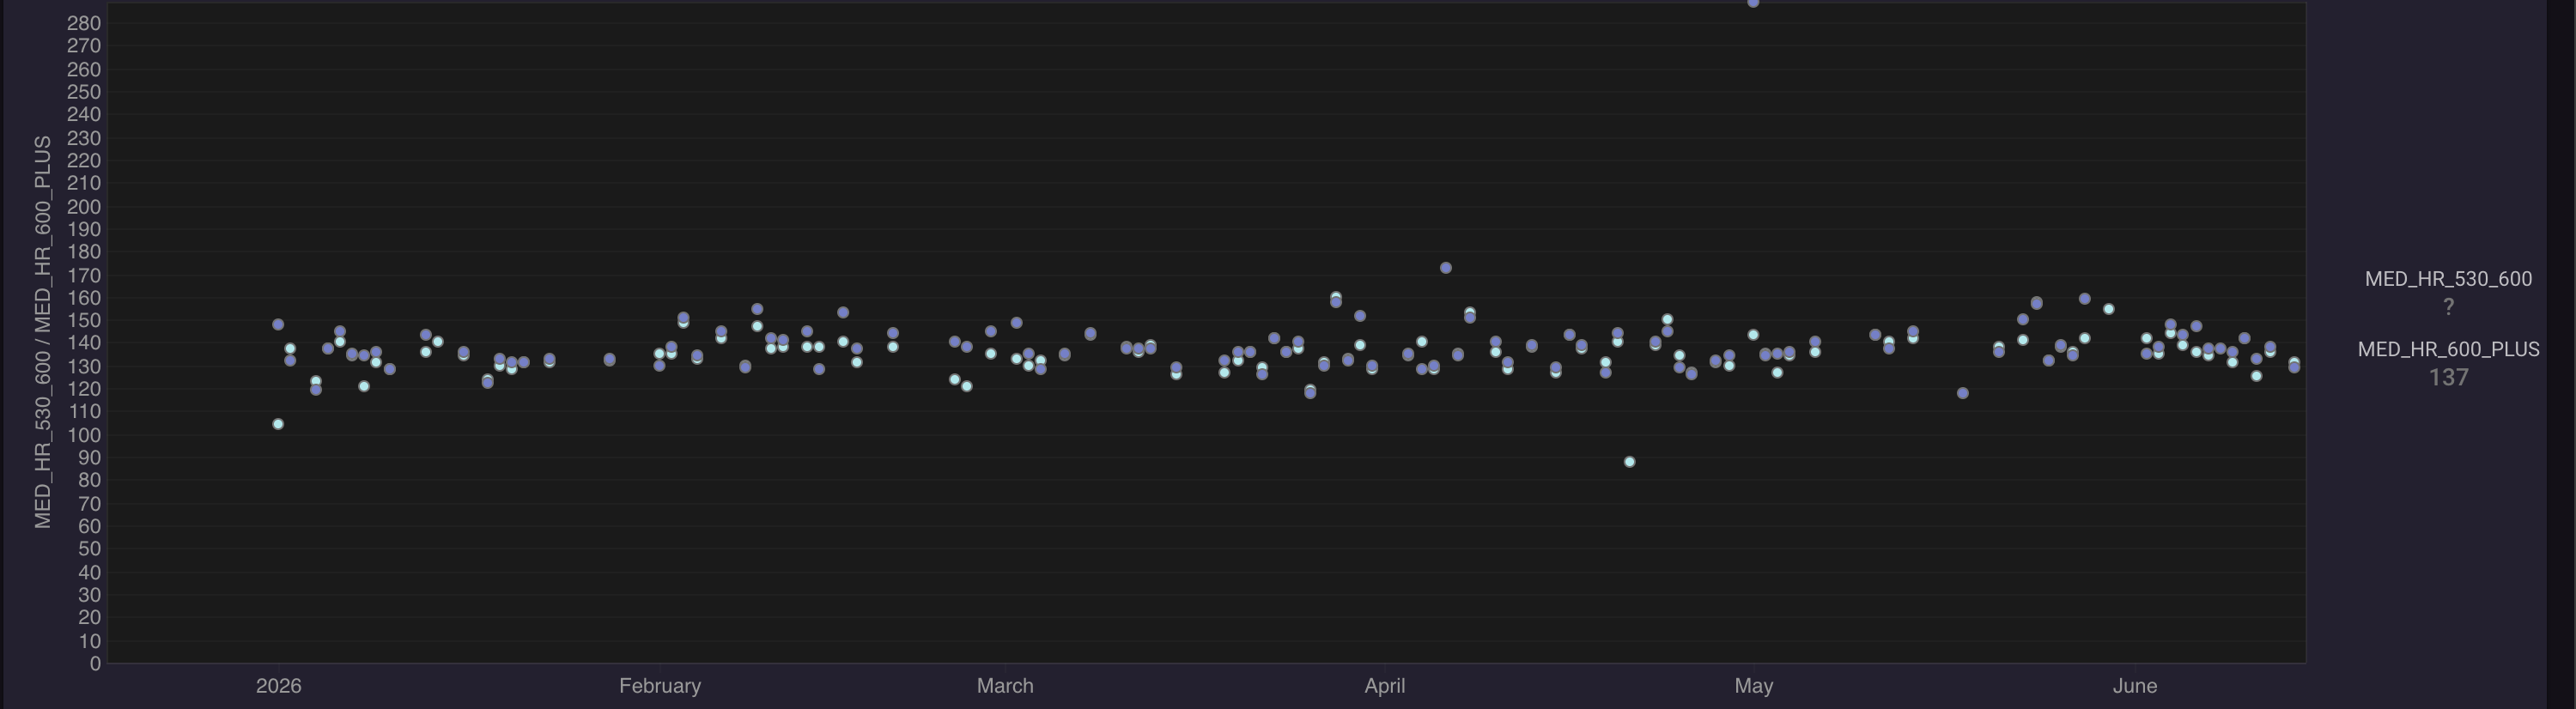
You can then use these to graph across time for a given range (or all the ranges). Note that you are not looking really at per activity as your HR will be massively impacted by what sort of session you are doing (for example, if I go out and run a hard workout, my HR during rest periods will be substansially higher than when I’m doing that rest pace during an easy run.
Which shows my 530_600 and 600_plus graphs over this year. I think it can probably be useful to plot roughly how your HR is responding to paces over time when seen as a total.
I’ve also thought about perhaps providing a median monthly value which might be a little clearer. However, dots are good, as I think it’s easy to have the data skewed if you do more hard sessions in a month than a previous one.
Edit: forgot to include the custom activity field script (Written by Gemini):
{
  // === CONFIGURATION FOR THIS BUCKET ===
// Change these values for each custom field you create (in seconds per kilometer)
// Example: 4:30 is 270 seconds. 5:00 is 300 seconds.
const MIN_PACE_SECS = 270;
const MAX_PACE_SECS = 300;

const INTERVAL_SECS = 30; // N-second windows to average out spikes
const MIN_BLOCKS = 4;     // Requires at least 2 mins cumulative in this pace to count (4 * 30s)

// === MAIN LOGIC ===
let hrStream = streams.get('heartrate');
let velStream = streams.get('velocity_smooth');

// Exit early if the run doesn't have heart rate or GPS velocity data
if (!hrStream || !velStream) {
  null;
} else {
  let hrData = hrStream.data;
  let velData = velStream.data;
  let hrSamples = [];

  // Chunk the data into 30-second non-overlapping blocks
  for (let i = 0; i < hrData.length; i += INTERVAL_SECS) {
    let hrSum = 0;
    let velSum = 0;
    let count = 0;

    // Aggregate data within the current 30s window
    for (let j = i; j < i + INTERVAL_SECS && j < hrData.length; j++) {
      if (hrData[j] != null && velData[j] != null) {
        hrSum += hrData[j];
        velSum += velData[j];
        count++;
      }
    }

    // Only process if the block has at least 15 seconds of valid data
    if (count > 15) {
      let avgHr = hrSum / count;
      let avgVel = velSum / count;

      if (avgVel > 0.5) { // Filter out standing still / GPS glitch pauses
        let paceSecs = 1000 / avgVel; // Convert m/s to seconds per km

        // If the 30-second chunk fits our target pace range, save the HR
        if (paceSecs >= MIN_PACE_SECS && paceSecs < MAX_PACE_SECS) {
          hrSamples.push(avgHr);
        }
      }
    }
  }

  // If you didn't spend enough time in this pace bucket, return null to avoid noise
  if (hrSamples.length < MIN_BLOCKS) {
    null;
  } else {
    // Calculate and return the Median HR
    hrSamples.sort((a, b) => a - b);
    let mid = Math.floor(hrSamples.length / 2);
    let medianHr = hrSamples.length % 2 !== 0 ? hrSamples[mid] : (hrSamples[mid - 1] + hrSamples[mid]) / 2;

    Math.round(medianHr);
  }
}
}