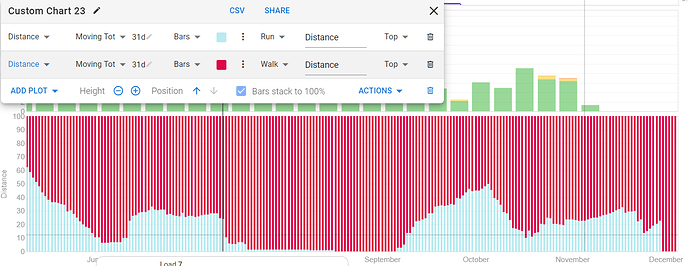
Not sure if this is really a bug or I am not doing something correctly, but I have the following issue. I have a custom field I input for each activity, a flag if the ride was with a group or not. Now I want to plot the moving total of the distance using that as a filter to get a visual for when I ride with others more. However, I cannot get the two bar types to stack; instead, they overlap each other. How can I fix this?

