Unfortunately, I’ve to report a bug(?) – resulting in the black “high heat” dot corresponding to a NaN.
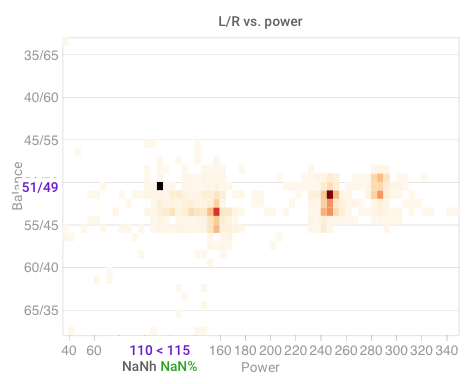
My own contour plot of the 2D histogram looks like this:
Unfortunately, I’ve to report a bug(?) – resulting in the black “high heat” dot corresponding to a NaN.
My own contour plot of the 2D histogram looks like this:
