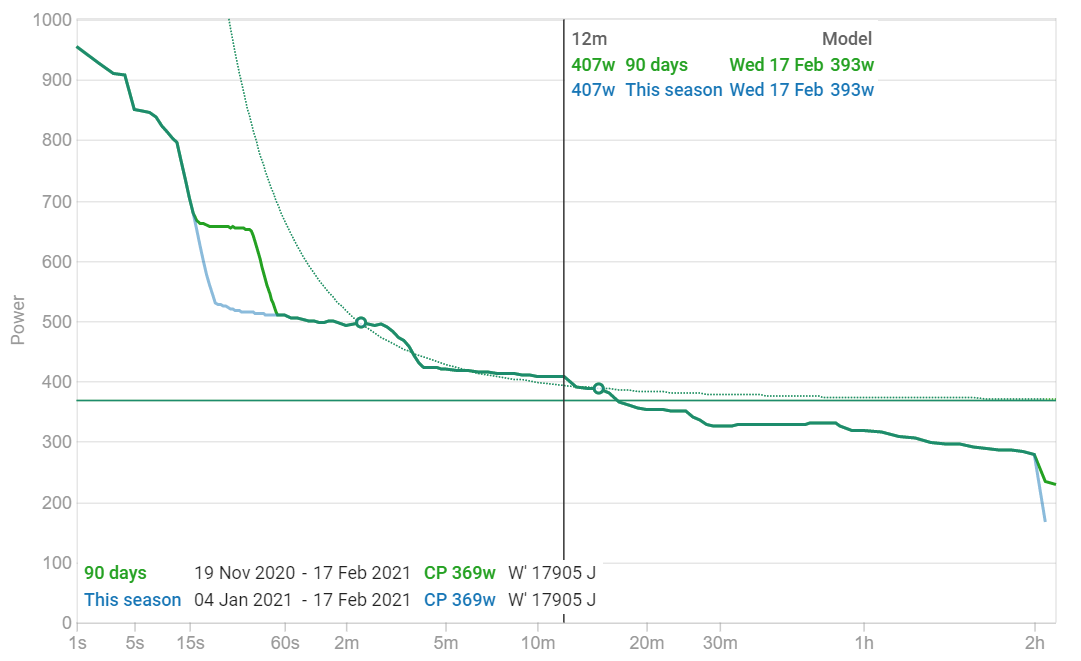
@David, I was curious if you could pass some insight on how the points are selected for the model on the power page. Yesterday, I did some testing including 3’ and 12’ tests following the procedure proposed here. The results from the tests were 491w and 407w for the 3’ and 12’ tests, respectivley. On the power page, I was curious why these points were not selected for the modeled power curve?
It looks for “flat spots” on the power curve where the same power is maintained for a bit to find max efforts. I have an outstanding todo list item to let you pick your own points / define your own curve which is what you need for your use-case.
1 Like
Thanks for the explanation.
Nice numbers there, regardless!
1 Like
You can now choose your own points for the power curve:
3 Likes
Hi @david,
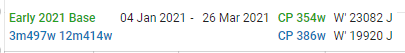
Would you consider adding an option to automatically select best efforts for the power curves for the chosen power model rather than identifying “flat spots”? I understand that this might be challenging to implement but it could be useful as there can be a relatively large difference in CP/FTP (and W’) between the two methods. Taking the season above with a user defined power curve at the best points produces the following results:
The defining your own points feature is useful for many applications but it does not allow the TEE metric to be calculated as the data points curve is not added in the list of seasons to the right hand side of the power duration curve so requires the user to identify this by hand.
Thanks
The “flat spot” algorithm was what I came up with when working on this problem. I haven’t figured out a better way to find max efforts yet. If anyone knows a better way to do this please post here.
I think you should be able to automatically pick best efforts if you look at the work done curve rather than power curve.
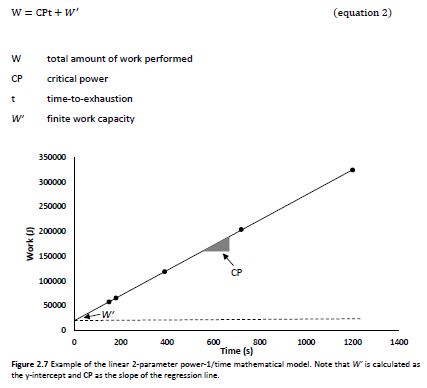
The best efforts should stand out as being furthest from (above) the trend line.
If all efforts are on the same line as in the simple example, it doesn’t matter what efforts you pick for determining the rider’s power model.
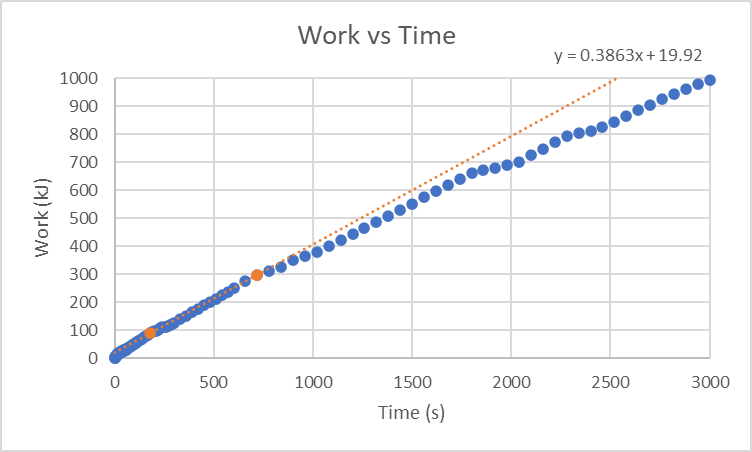
Taking this idea a bit further. If the points from the power duration curve are plotted as Work vs Time, then the best efforts can be found as the line between two points where no other points are above this line. Hopefully, the graphs below show this in some more detail.
When you plot the points of my all-time power duration curve as Work vs Time, you get the following graph. The line between the two best effort points at 3m and 12m can be seen in orange.
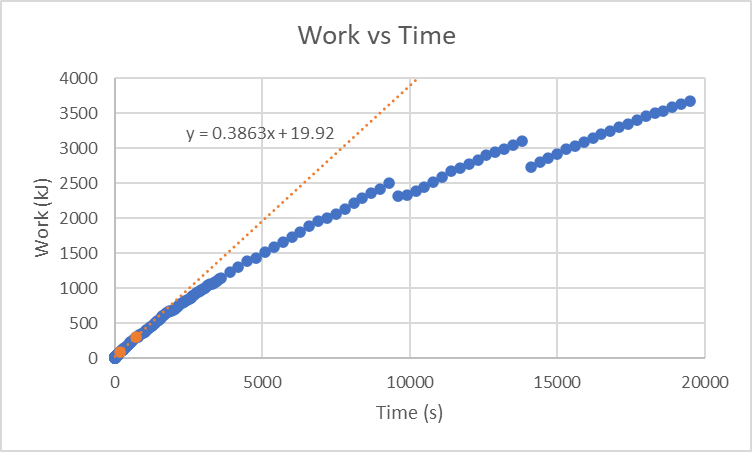
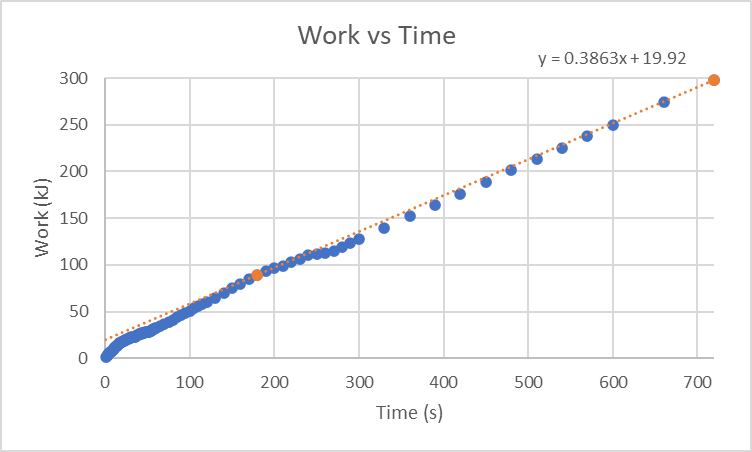
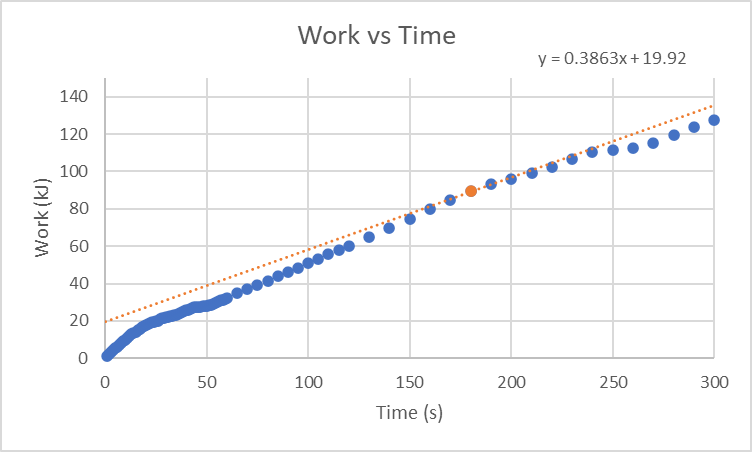
Zooming in in the following images, it can be seen that there are no points above the orange line.
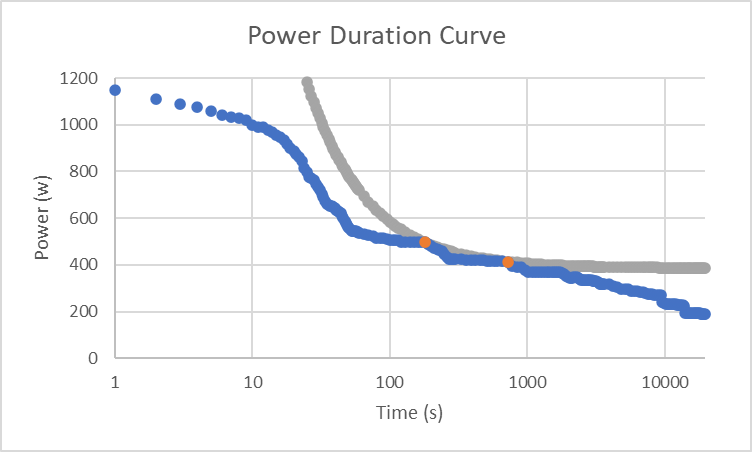
So if an algorithm can be written to find the line between two points with no points above it, then this can be used to find CP and W’ for the two best efforts in the power duration curve, as shown below.
2 Likes
Nice charts!
Tx guys. Quite a bit to work with here.
3 Likes