Crickles - Understand your cardiac load

Crickles is a free companion to Intervals.icu that uses your activity heart rate data to estimate cardiac load, set heart rate zones automatically, and compare your accumulated load with other Crickles users in your age group. I develop Crickles, with cardiology input from Mark Dayer, a consultant cardiologist. David introduced it here in January 2025, while I was rebuilding it around Intervals. It has now been running smoothly for the past year and I’ve expanded the introduction here:

Crickles does not plan sessions or build workouts, and it is not an alternative to Intervals - Intervals already does the collecting and the planning and I have no interest in duplicating any of that.

In summary, Crickles gives you:

Heart rate zones that set themselves. You are never asked for a maximum heart rate or an LTHR. Crickles estimates the rate you could hold for an hour from sustained efforts in your activity history; it sets your zones from that. There is no need to do a test, and it keeps it up-to-date automatically.

One number for the load on your heart, across every sport. An hour at that sustainable rate scores 100. Because it comes from the heart rate trace alone, a swim, a row, a run and a ride land on the same scale and can be added together, which is not something watts or pace will do for you.

Some idea of whether that is a lot. Crickles compares your accumulated cardiac load with that of other users in your age group, helping you see where you sit and track that back to the efforts that put you there.

A check on whether your heart rate data can be trusted. Every heart rate trace gets a Regularity verdict, and only activities that pass every test are allowed to set your sustainable heart rate. Unreliable recordings can distort it and the calculations that depend on it. Crickles catches dying chest straps and optical warm-up artefacts that would otherwise pass silently into your numbers.

There are three things worth knowing if you are thinking of using Crickles:

  1. Crickles is emphatically not a medical tool and cannot diagnose anything.

  2. Activities that reach Intervals only via Strava cannot be processed, because Strava’s API terms do not allow it, so your devices need to be connected to Intervals directly.

  3. You can read the background articles freely at https://crickles.org. To analyse your own activities, open the Crickles Navigator from the website and connect your Intervals.icu account.

If you have any thoughts or questions, please do reply here or drop me a line through the Contact page on https://crickles.org.
5 Likes

Very interesting idea! I train mainly with heart rate and prefer it over training with power as heart rate reflects stressors which power doesn’t. Your main innovation is basically an “eLTHR” equivalent to eFTP, right? You estimate the sustainable HR based on recent efforts and set the LTHR and the zones around it, do I understand that correctly?

Before I test it out I would be curious about one thing: How much does LTHR actually change over time at increasing age and changing fitness, both long term and within one season? We know that eFTP can be a useful tool as the power at LT2 can change fairly dramatically with training but I had always assumed that the heart rate at LT2 is significantly more stable. What does the sports science say about this?

I would be worried that my LTHR is underestimated if I don’t do long enough work around threshold for a couple of weeks. If I can do an FTP test once a year to establish a LTHR and that is fairly stable, why should I risk producing incorrect HR zone estimations with your method?

Thanks and best regards,

Paul

1 Like

Looks very interesting.

Does it only import the last three months? Any way to get older activities imported?
(To clarify: on some pages I see there is old data, but on the Effort Spots and other per-activity pages only the last three months.)

Hi Paul,

Yes, the motivating idea was that we would have a proxy for LTHR, and in early versions of Crickles we called it that. However, Crickles never measures blood lactate, so we re-labelled it sustainable heart rate, which describes what we can actually observe and is just as useful.

On the rate of decline, Mark has done a review of the literature and I have done some empirical analysis, none of which is on the site yet - your question is a good prompt to get round to it! My own sustainable heart rate has fallen by about 7 bpm in a decade, roughly the rate the Tanaka formula gives for maximum heart rate by age.

Sustainable heart rate averages the best value from the last four weeks with the best from the last twelve, each value being the highest sustained heart rate from a single session, scaled to its one-hour equivalent. So a couple of weeks without a hard effort changes nothing, and a hard effort need not be a long one: anything from six minutes upwards counts. There is a full description of the calculation at Sustainable Heart Rate Levels in Crickles – Crickles .

As for an annual test, it is one data point with its own error: if you are under par that day, or your strap misreads, your zones are wrong for a year. The adaptive estimate uses every activity, and refuses to calibrate from any that fail the Regularity tests.

Ian

Hi,

No - the older activities are imported; it’s the per-activity pages that only list the last 90 days. Your personal history in Crickles starts at the beginning of 2025, and you can see all of it on the Sustainable page, which shows up to two years; the Dashboard shows the most recent year.

How far back each page goes is a design choice rather than a limit on what has been imported. The charts are sized to what reads well on one screen - the Dashboard can show a year, but more than that starts to get cluttered - and on the per-activity pages it is a judgement about how far back people will want to scroll through a dropdown list. That could be extended if there’s demand for it - do you think that more history on some of the other pages would be useful?

If you have activities in Intervals from before 2025 that you expected to see here, let me know and I’ll look into it. One common reason is that activities which reached Intervals only via Strava can’t be processed.

Thanks for you reply Ian. I agree with you that testing only once a year may produce inaccurate data, particularly may underestimate the LTHR/SHR if the conditions are suboptimal or even overestimate if the HR monitor is faulty.

I do believe that a testing protocol should still be used when trying to determine LTHR with you method. “Only” 6 minutes of work sounds like little but may not actually appear in your training. I train a lot but specialise on ultra-endurance and thus most of my work is easy work. I do some long intervals below threshold and hard intervals usually for around 4 minutes each. I mostly train in the low countries and therefore don’t encounter any 6+min hills either. The result of this training profile creates a strong underestimation of my LTHR as I had assumed.

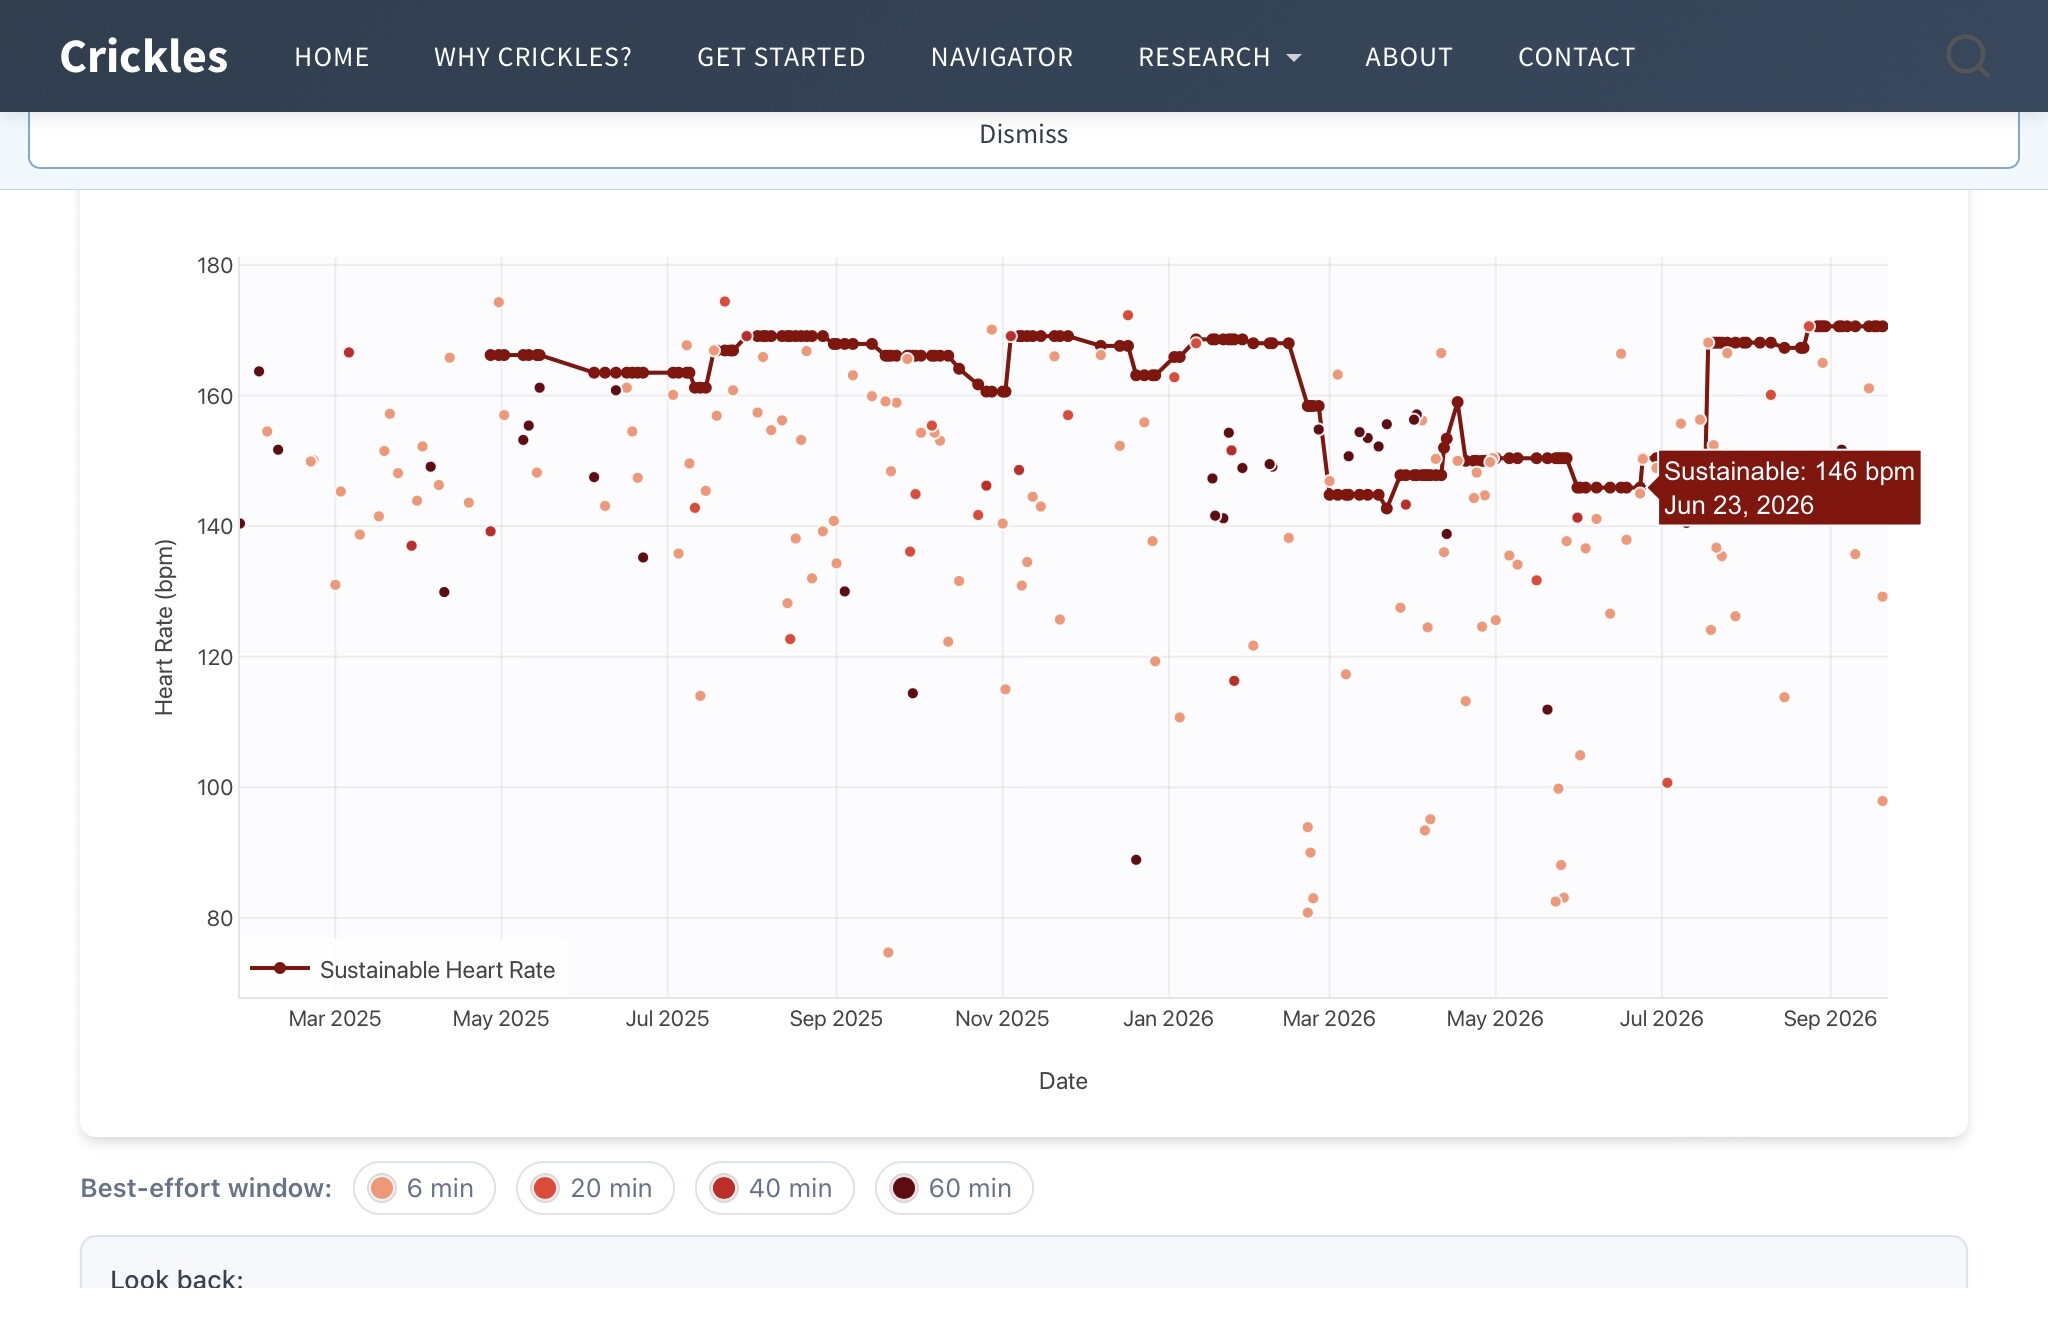
As soon as I hit some hills my sustainable heart rate increased, from 146bpm in June to 171bpm in August. At my last FTP test, my heart rate over 20 minutes was 185bpm, so the more recent estimations your model produced definitely gets in the right direction.

All of this is not too say that your method is flawed in any way, I do like the idea. However, to create accurate results, it would be advisable to repeat a test protocol of at least 6 minutes every quarter. Then again, that’s almost the same as doing a regular FTP test. And if we don’t actually expect LTHR to decrease by more than 1bpm per year I am unsure what benefit I get from continually updating my LTHR, the “risk” of creating underestimations with your method if I don’t hit my max numbers for 6min+ once a month/quarter seems higher than the risk of undercooking an FTP test once in a while.

Maybe my personal training style is so unusual that I simply don’t fit the template or perhaps there is another benefit of your method that I am completely overseeing. Please don’t hesitate to correct or educate me.

I have a particular activity I’d like to look at, and it happens to be almost four months old.

As for the design choice, my two cents are that people will only scroll as far as they want to, no matter the length of the list. On the other hand, people who do want to scroll more will be limited by a cropped list.

Fair enough. Thanks for the feedback. I’ll extend the selection, and see if I can find a nice way to do it. I’ll post on Crickles website when it’s done.

1 Like

One thing making your results differ from what you’d expect is that Crickles leaves out activities with non-Regular heart rate traces when it sets your sustainable heart rate - a non-Regular trace usually means spikes or dropouts from the sensor. Across everyone this removes about 7% of activities, but in your case the proportion is higher. You can see it on the screenshot you posted: every point on the chart that lies above the line was excluded. A point from a Regular activity can never sit above it, because the line is always at least as high as the best Regular value of the last four weeks.

That also bears on your training profile. A good number of the excluded points are from the 60-minute window - the darkest dots - and there are 6 minute (lighter ones) above the line too. The problem hasn’t been a lack of qualifying efforts, but that many of them were set aside.

I’m happy to pick this up with you directly and go through your detailed data together.

Hi. I put a fix in for this that I’ll be documenting on crickles.org over the next couple of days. Thanks for the suggestion.