That usually means that one of the streams is missing. These fields require power, HR and speed streams. I’m packing for a weekend trip and will not have time before monday to get much deeper.
What specific ranges?
Try this:
out: {
  if (activity.type !== 'Run' && activity.type !== 'TrailRun' && activity.type !== 'VirtualRun') break out;
  var h = (icu.streams.heartrate || []).length;
  var s = (icu.streams.velocity_smooth || []).length;
  var p = (icu.streams.watts || []).length;
  var g = (streams.get("GarminGCT")?.data || []).length;
  console.log(`💎 HR:${h} Speed:${s} Power:${p} GCT:${g} ${h&&s&&p&&g?'✅':'⚠️'}`);
}Thanks, that helped me figure that @MedTechCD’s code was referring to a RunCadence stream, but mine is actually named “cadence”. Probably a Stryd thing… Now I need to retrieve the name of the GCT field in the fit file from Stryd (which is apparently also different), and that should work. I guess fitfileviewer is the way to go?
Thanks again to you both!
Are you using stryd air or stryd nextgen?
The nextgen. I’m not sure whether it makes a difference, but I haven’t enabled the RD footpod connection to the watch. My Stryd is just connected as an accelerometer, and I still get the running dynamic metrics streams on Intervals (LSS, GCT, vertical oscillation,…)
Yes, but is more confusing. What did you called GCT stream?
I create a Custom Field “Test Stream Block Checker”, with simplified setup, you need to change only these:
  let hrTarget = 147;
  let hrRange = 5;
  let pwrTarget = 352;         //. activity.icu_ftp*0.95;
  let pwrRange = 30;
  let paceTarget = "4:09";
  let paceRange = "0:50";
  let minPoints = 30;

  // TRY THESE COMMON STREAMS - USE THE ONE THAT WORKS
let streamNames = ["GarminGCT"] // Specify the target data stream here.This worked perfectly, thanks a lot for the code!
I’ve slightly modified it to calculate an average of the metrics over all the blocks meeting the criteria instead of only the longest one. Then I set up 2 separate custom fields : one for the min GCT and another for the max LSS, both calculated only for blocks longer than 2m at threshold pace. This allows me to track these metrics over time :
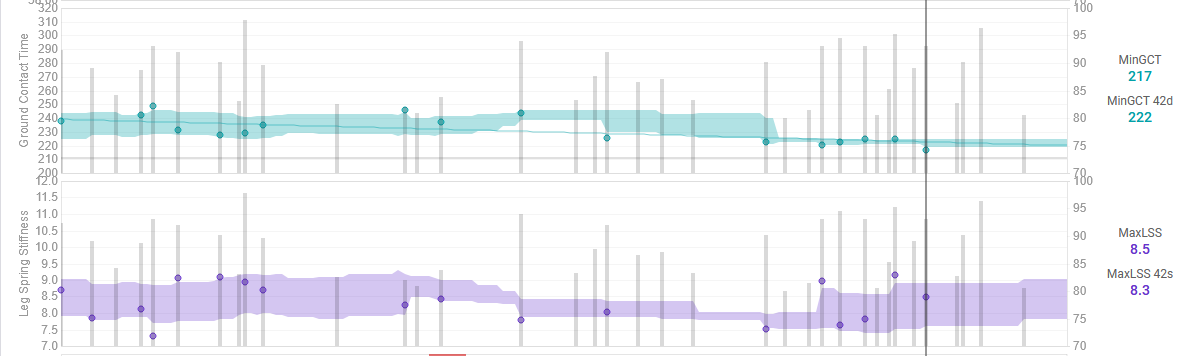
Now we’ll see if the next 2 months focusing on short intervals at VO2max and plyometrics let me see some improvements, and most importantly if that leads to a faster pace ![]()
Thanks again for your help!
This is interesting. However, at a fixed threshold pace, tracking the trend of Avg. GCT and LSS seems more meaningful, reflecting the sustainable adaptations from your plyometrics and VO2 max drills.
Min GCT and Max LSS are useful for short-term adaptations assessment but are prone to sensor noise and outliers, and are not elicited at threshold intensity. A more robust method to calculate these “peak” metrics is to first compute the Average GCT and LSS for short, high-intensity intervals —such as 200m repeats—filtered for stable grade and air-power, and a minimum pace at or faster than VO2max. The minimum value from these interval averages then becomes your “Min GCT,” and the maximum value your “Max LSS.”
1 Like
Cadence Data Source
- Without RD Footpod Connection: Cadence comes from the watch’s built-in sensor (the “cadence” record field), which measures movement at the wrist. This method is less accurate. To use Stryd’s more precise cadence, you must create a data stream for the “Cadence” field.
- With RD Footpod Connection: Stryd’s running dynamics are automatically mapped to their equivalent Garmin metrics.
Unmapped Stryd Metrics
When using the RD footpod connection, the following advanced Stryd metrics do not have a Garmin equivalent and are therefore not mapped:
- Stryd Form Power
- Stryd Air Power
- Stryd Leg Spring Stiffness
- Stryd Impact Loading Rate
- Stryd Vertical Oscillation Balance
- Stryd Leg Spring Stiffness Balance
- Stryd Impact Loading Rate Balance
Intervals.ICU Integration
In Intervals.icu, the “cadence” record field from the activity is mapped to icu.stream.cadence for standardized access and analysis.
2 posts were split to a new topic: Custom activity fields not changeable
Hi all,
In Garmin Fit files, is there a better way to access unknown messages than this? (I’m reading the unknown message from the Garmin Fit that records the battery level based on the fact that it has five unknowns fields and the second one always has a value of zero.)
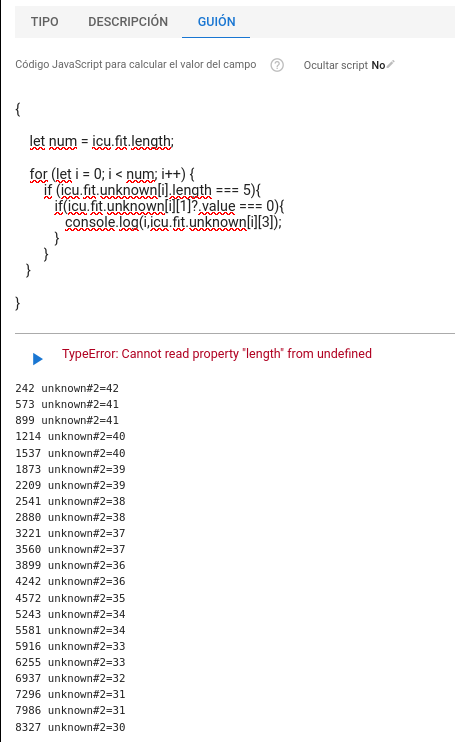
Thanks!
Try
{
  for (let m of icu.fit["m_104"]) {
    let timestamp = m[0].getValue();
    let value = m[3].getValue();

    if (timestamp !== undefined && value !== undefined) {
      console.log(`Timestamp: ${timestamp}, Battery: ${value}%`);
    }
  }
}Perfect! Thank you.
How did you know the message was 104? Perhaps through trial and error?
By analysing the logs.
Thanks! ![]()
Found a better script from David:
Did you ever implement this?
In fact, I am trying to get a running bar graph with individual bars from power-phase start to end in activity timeline (well, secondary timeline page). Any idea on how to do this?
I thought I define a custom stream for start (with values > 270º shifted down by 360º) and stop values of the power phase (doable) … but how do I then define a chart with a bar from one to the other value?
I am looking for a way to calculate KJ for all activities without power in this way:
Take avg HR from the activity → calculate KJ by using avg Power at this avg HR (over the last xy days)
Thanks for help! ![]()
Trying to create a custom computed activity field. However, no matter what I enter, when I click the “run” triangle icon on the javascript page, I get an “ActivityId is required” error. Even if I pick an existing custom field used by hundreds of people that someone else created and try to run it, I get the error. I also added one of the previously created custom fields to my activity page and performed new activities and tried reanalyzing the activity and all I get is ‘?’ as the activity value on the activity page. What am I missing or is there a bug? FWIW, I am quite capable in javascript.