I don’t understand how other apps like Garmin Connect can use and create segments. I have a GC account not premium and I can create segments and view classification between segments.
It would be nice to know if @david has thought about managing the segments part in intervals as well or if he is not going to implement it
No, just an idea. What I want to say was: Just because there is a patent, that doesn’t mean you are not allow to do anything mentioned in this patent. You are not allowed to do the claims. But you could do it, if you license it. Or you do it somehow different than claimed.
But I am not a lawyer if I have to say that. And using a barometer has nothing to do with GPS
Fully agree. As I mentioned above, I fully understand the concerns of David.
@MedTechCD Please share the translated chart Looks good too.
Done.
It’s all about the size of the company with patents. Garmin can probably do whatever they like given their position in the industry and deep pockets. If Intervals.icu implements segments (even completely differently) then Strava might well kill API access and start sending lawyers letters. Thats not what I want to be spending time dealing with
Garmin will have a load of patents themselves, ones that Strava would be using. It’s pretty common for companies like that to cross license in a type of quid pro quo without even money exchanging.
Though the method in particular US patent is so obvious, it’s no wonder the EU equivalent was withdrawn, and quite strictly applies to the USA only.
I am not sure I understand but this has nothing to do with strava (I put it wrongly). Call it effort or “smart itinerary”, it would be a piece of road between point A and point B, with coordinates created by GPS and devices by Garmin or Wahoo and uploaded via Wahoo without even going through Strava. I would be able mark two points on Intervals graphs and call the effort My Local Climb. Every time i go through it, one of the brilliant algorithms in Intervals would detect My Local Climb and offer the opportunity to compare each of those efforts or just the ones I want. That’s the way it works in WKO5. Is there any patent infringement risk?
It really doesn’t matter. If david implements something even remotely similar to segments, whether it makes use of any strava data or not; Strava may sue intervals.icu, or cut off their API access for intervals.icu. Even if he hasn’t violated the patents that they hold, it would be a major headache for him.
Climb details is a very nice chart to have. I usually tag my climbs and then create segments on that specific climb. Unfortunately, there’s nothing close to Strava’s segments compare. For that I use a modified APK of Strava’s application unlocking this feature.
Where can I find the translated chart? I don’t see it in the list of custom charts from contributors.
I was able to find it under the Activity Charts section so it is definitely there. Works well for runs too, really nice script
This looks great, thank you @MedTechCD and Serge.
Can you help me understand what the figures are across the top - presumably some sort of TSS related score for each climb (but not TSS?)
I also wondered what was happening in the first image below
where my cursor seems to select three climbs at once. I wondered whether this was because the chart showed all three climbs which were part of one longer climb, but the overall picture seems to suggest different?
But this chart looks like it’ll be super useful, thank you both.
This is a well-known approximate assessment of the severity of climbs. It is the product L*P^2, where L is the length in km and P is the average gradient of the climb in percent.
You can think of it as “perceived altitude meters”.
Ah yes, thank you, that makes sense.
Do you also know what the D+ figure at the top of each box refers to? I wondered if it meant total altitude gain in that climb, but that doesn’t quite work out against length of climbs and average gradient. So in the lowest box above, D+ is 36.4; at an average gradient of 7.7% over 0.4 km, I’d have gained 30.8m, so those two figures don’t align?
It should be the elevation gain.
36,4m / 7,7% = 472,727 m
That’s probably rounded down to 0.4 km.
But there are still some mistakes, not huge, but I am to nerdy to accept
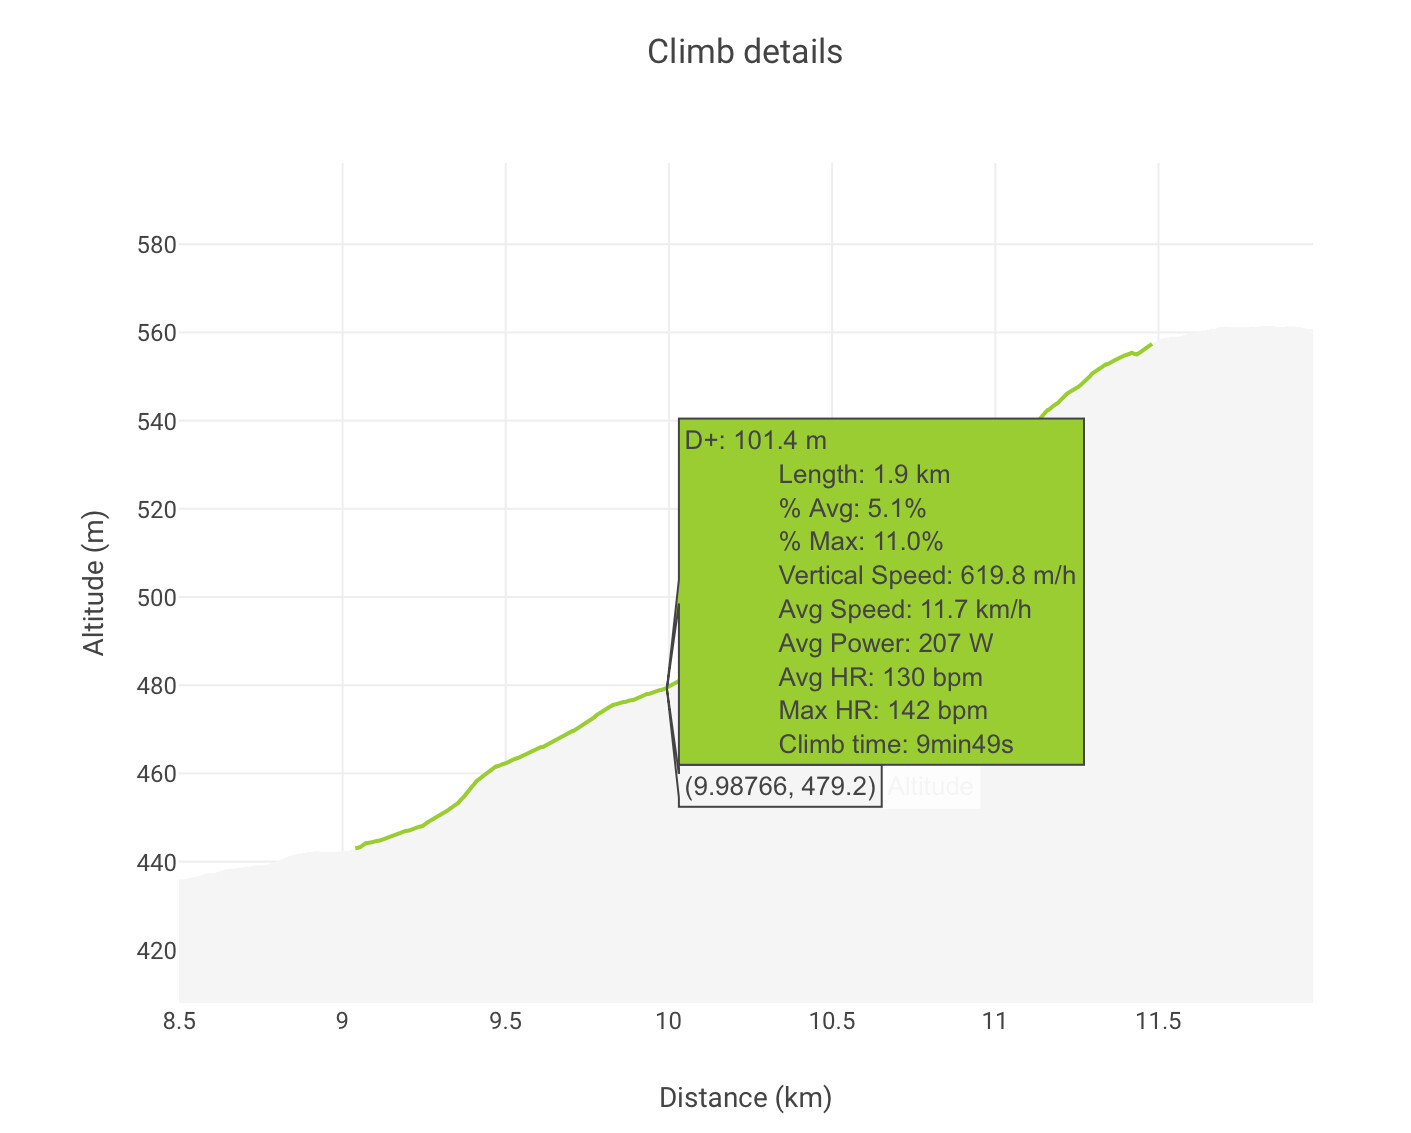
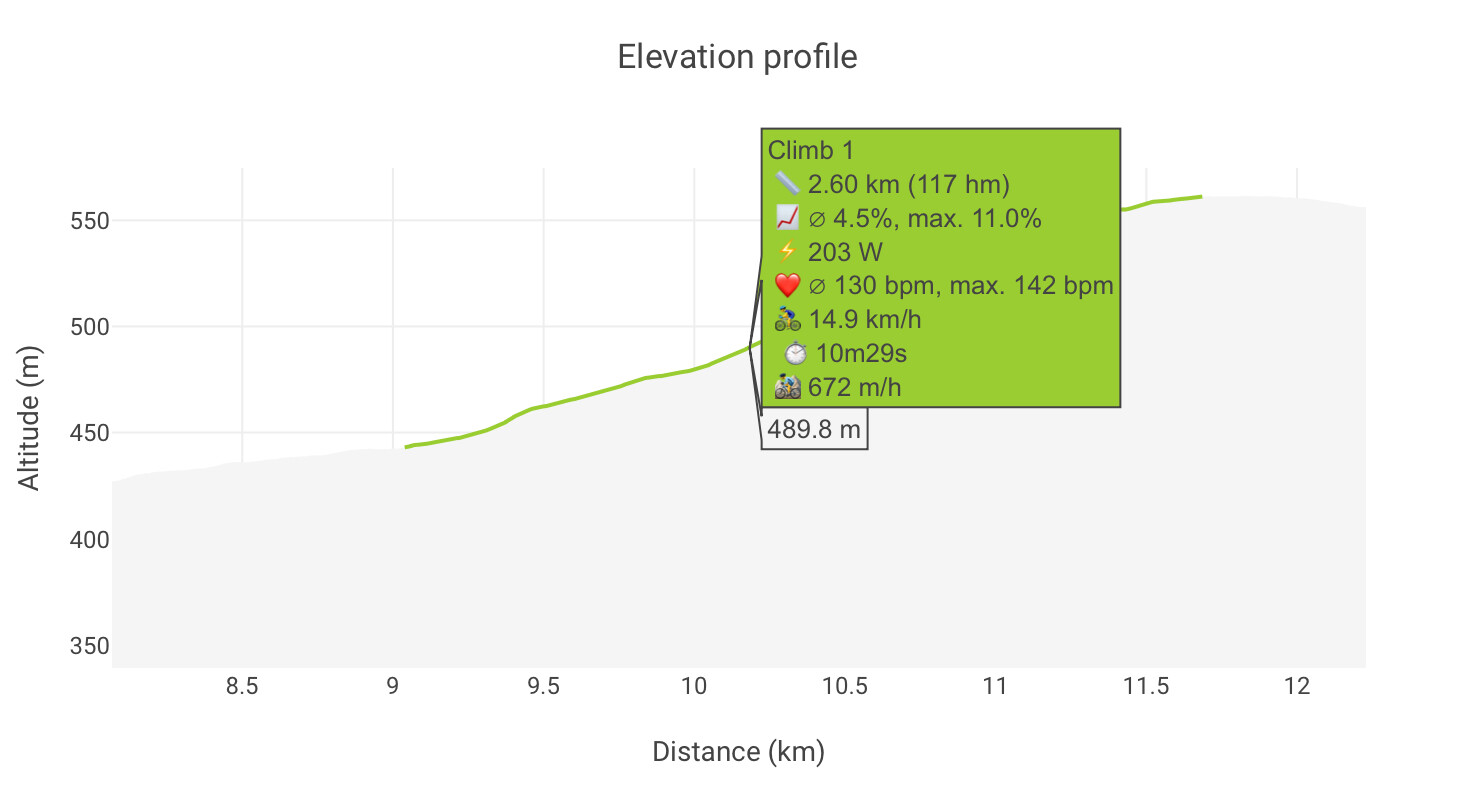
The climb starts at kilometer 9.1 and ends at kilometer 11.5, making it 2.4 kilometers long. However, some details are inaccurate. For instance, the elevation gain (D+) from 440 m to 560 m is actually 120 m, not 101 m. This discrepancy arises because smaller climbs are combined into one larger climb, ignoring the flat sections in between.
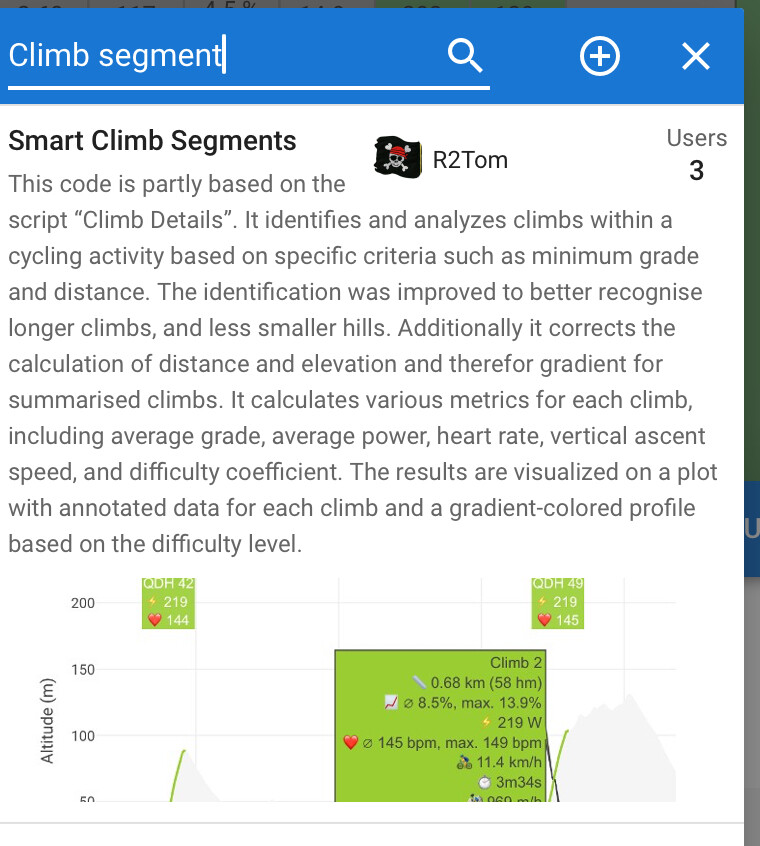
Big thanks to Serge for creating that and @MedTechCD for the translation! I adopted the idea of showing detailed segment information by hovering over the chart and made the necessary corrections. However, the hill detection system works slightly differently, so the segments it generates won’t exactly match the originals. Still, it shows the “correct” values for the segments.
You can take a look, if you search for “Climb Segment”
Ah, forgot to translate. It´s indeed altitude gain, from Denivellation in French.
I also have made a copy of SergeNico’s chart that I made a few changes to, firstly I modified it for runners, converted to US Imperial units (for the most part), changed to english, minor layout changes. etc.
I simply sent him a direct message to thank him, as well as ask for his consent to publish my version.