It’s still there. You may need to add some search text to make it visible.
1 Like
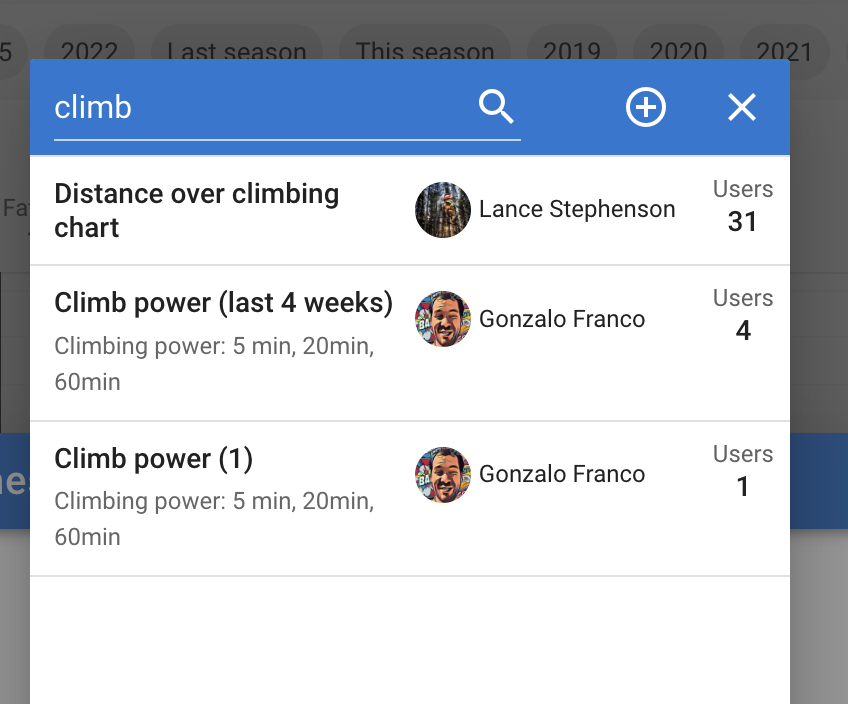
I was able to find it under the Activity Charts section so it is definitely there. Works well for runs too, really nice script
This looks great, thank you @MedTechCD and Serge.
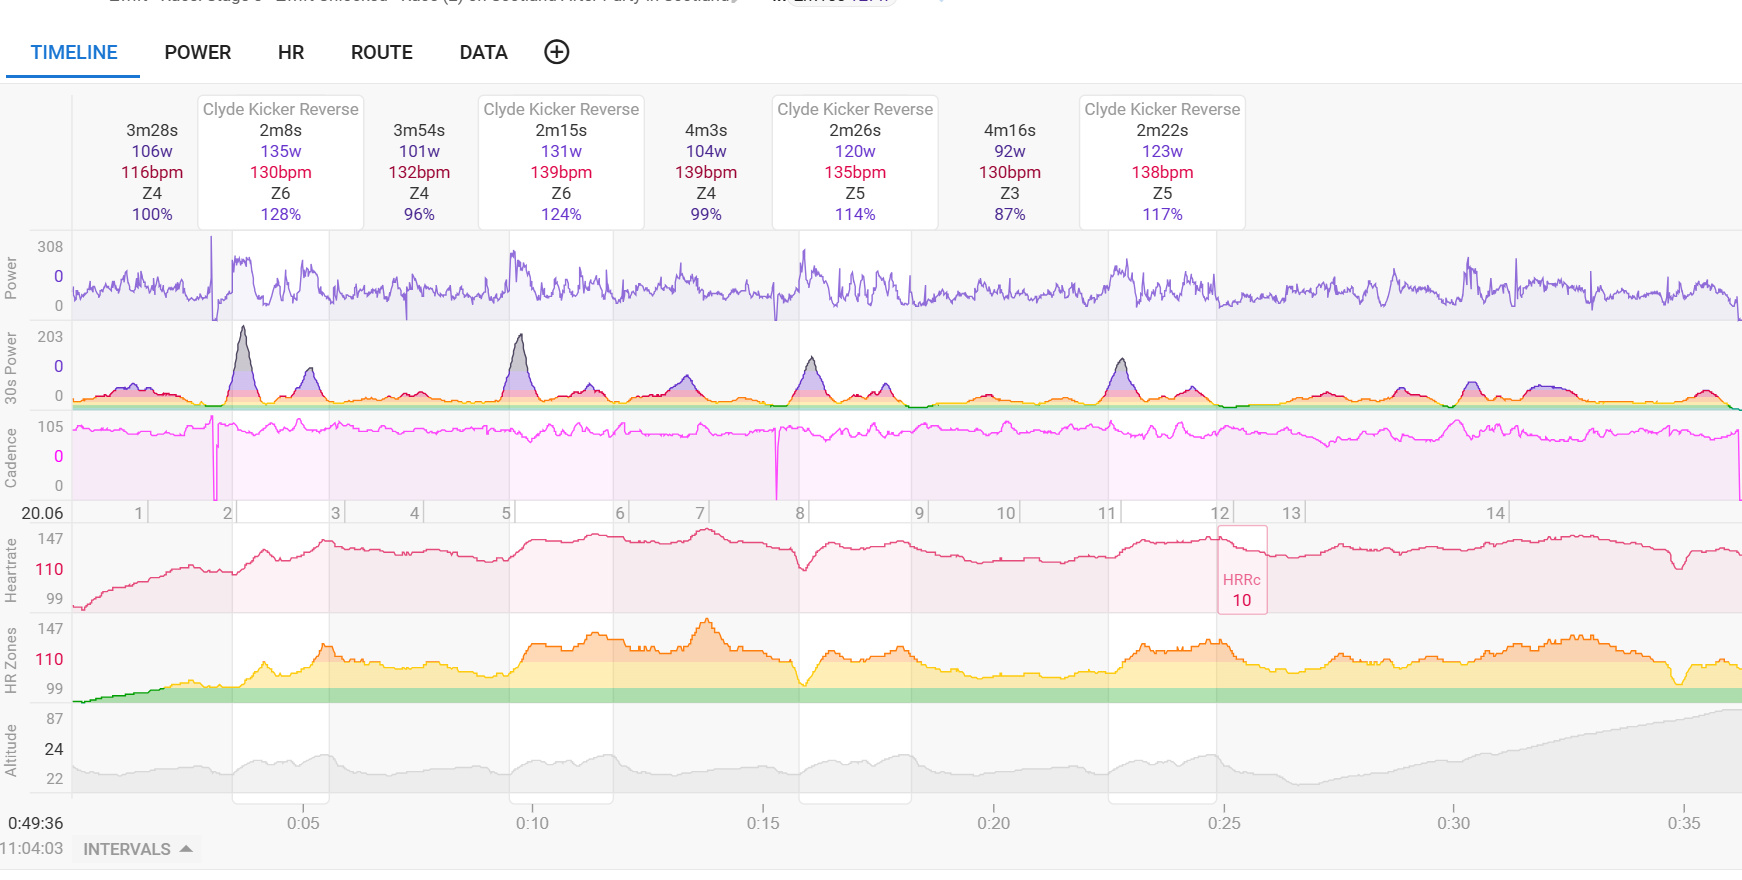
Can you help me understand what the figures are across the top - presumably some sort of TSS related score for each climb (but not TSS?)
I also wondered what was happening in the first image below
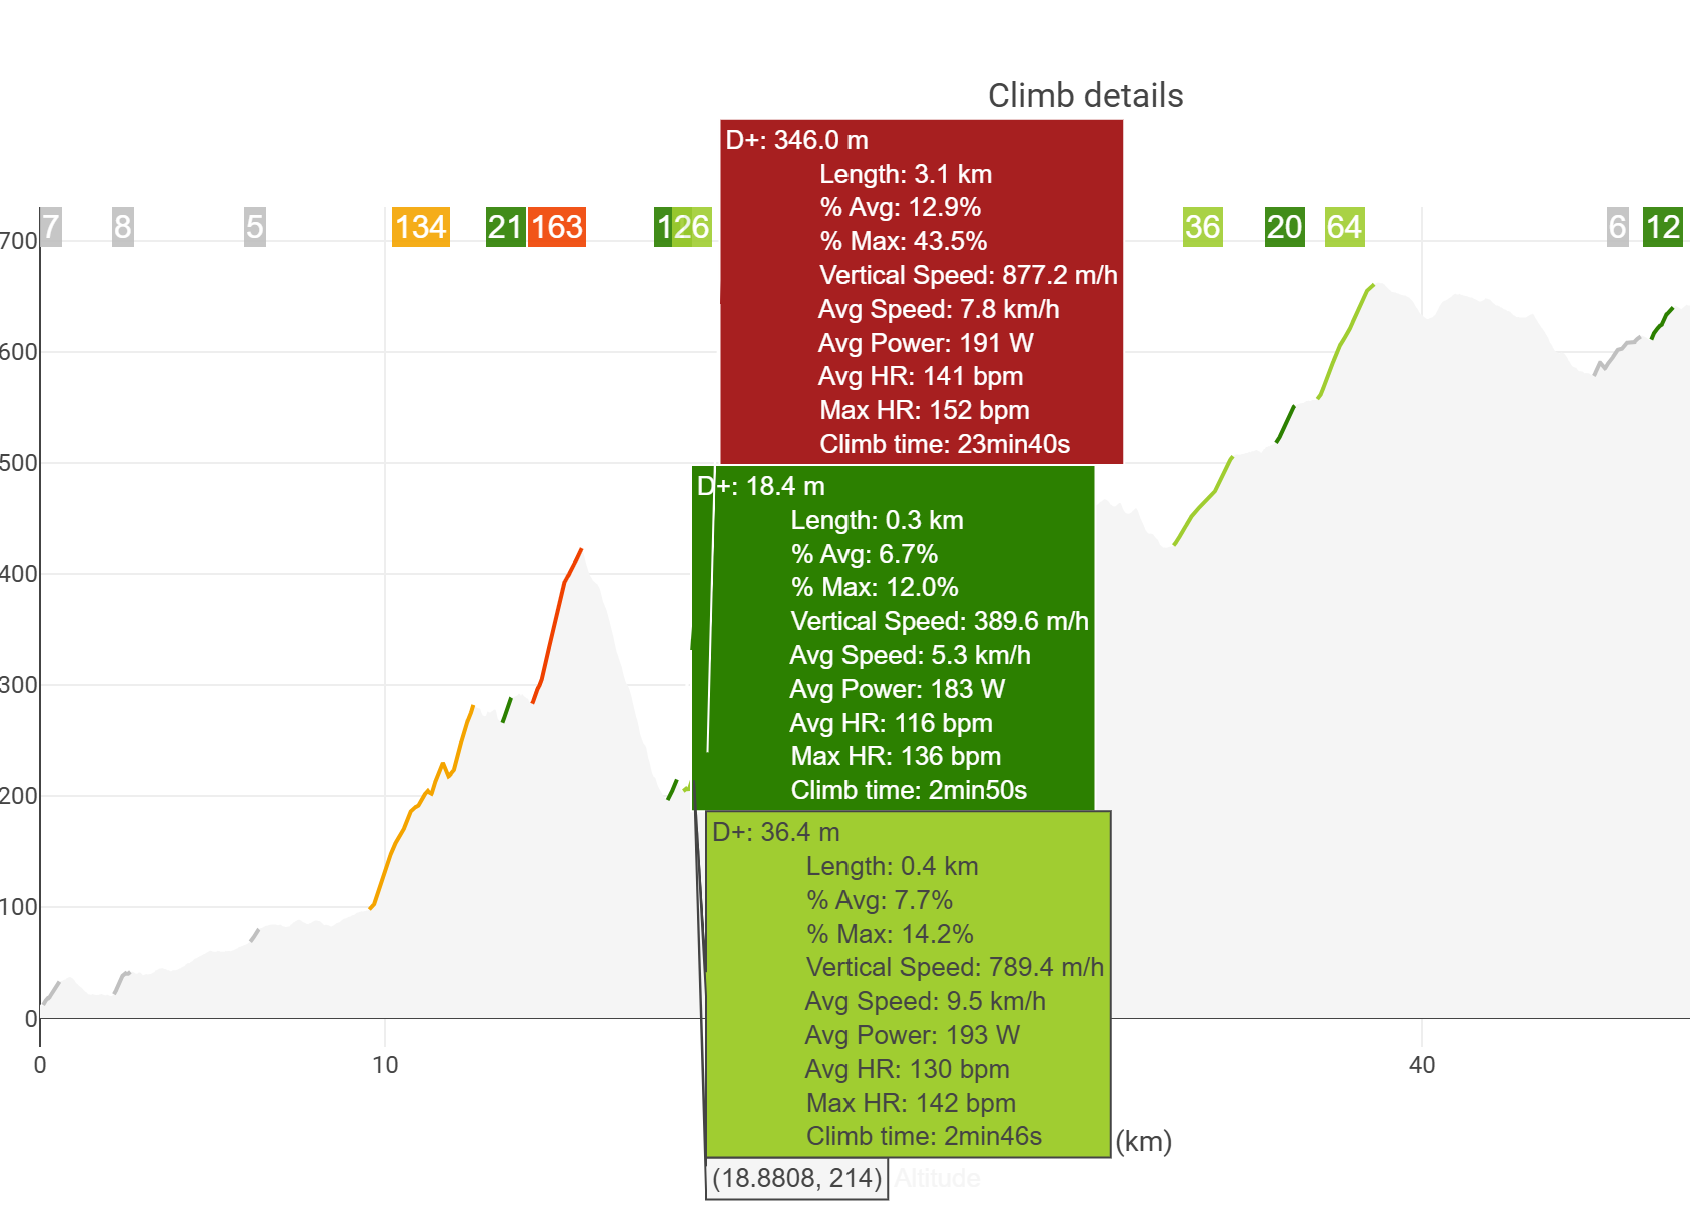
where my cursor seems to select three climbs at once. I wondered whether this was because the chart showed all three climbs which were part of one longer climb, but the overall picture seems to suggest different?
But this chart looks like it’ll be super useful, thank you both.
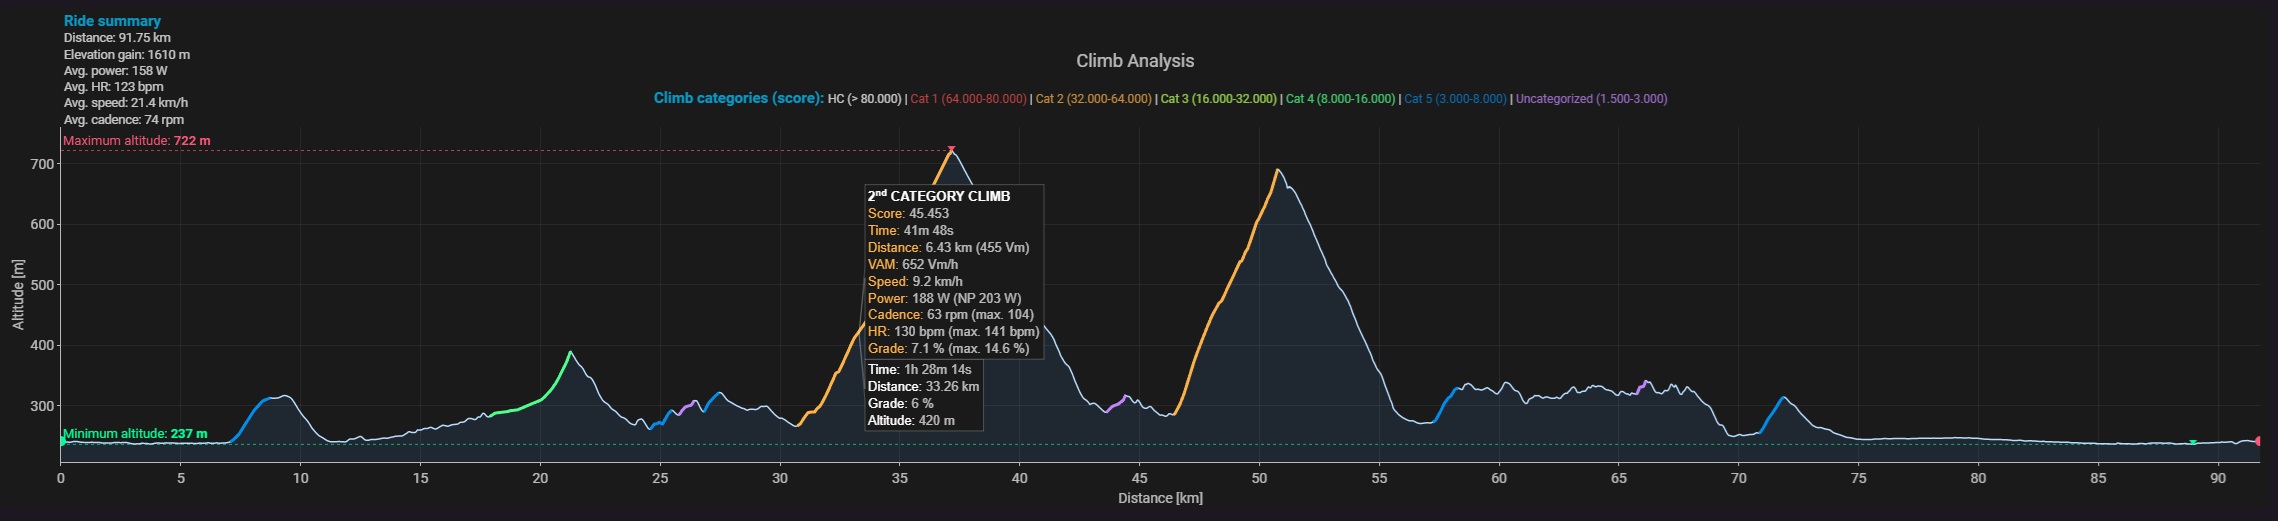
This is a well-known approximate assessment of the severity of climbs. It is the product L*P^2, where L is the length in km and P is the average gradient of the climb in percent.
You can think of it as “perceived altitude meters”.
1 Like
Ah yes, thank you, that makes sense.
Do you also know what the D+ figure at the top of each box refers to? I wondered if it meant total altitude gain in that climb, but that doesn’t quite work out against length of climbs and average gradient. So in the lowest box above, D+ is 36.4; at an average gradient of 7.7% over 0.4 km, I’d have gained 30.8m, so those two figures don’t align?
It should be the elevation gain.
36,4m / 7,7% = 472,727 m
That’s probably rounded down to 0.4 km.
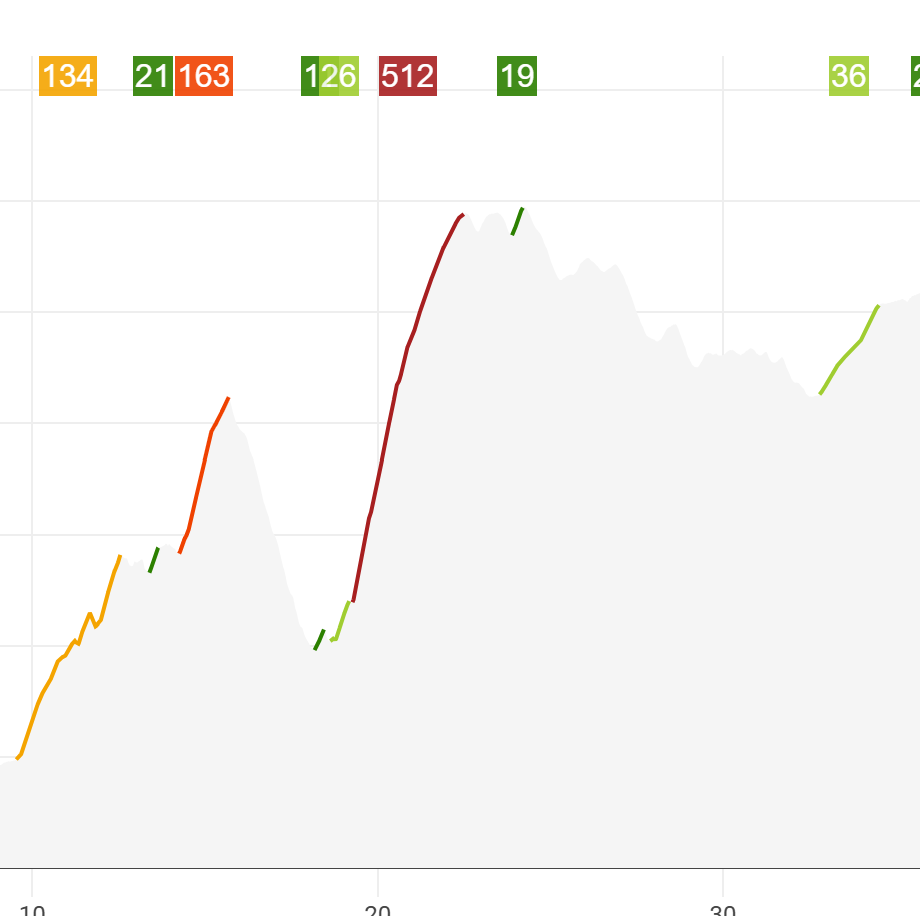
But there are still some mistakes, not huge, but I am to nerdy to accept ![]()
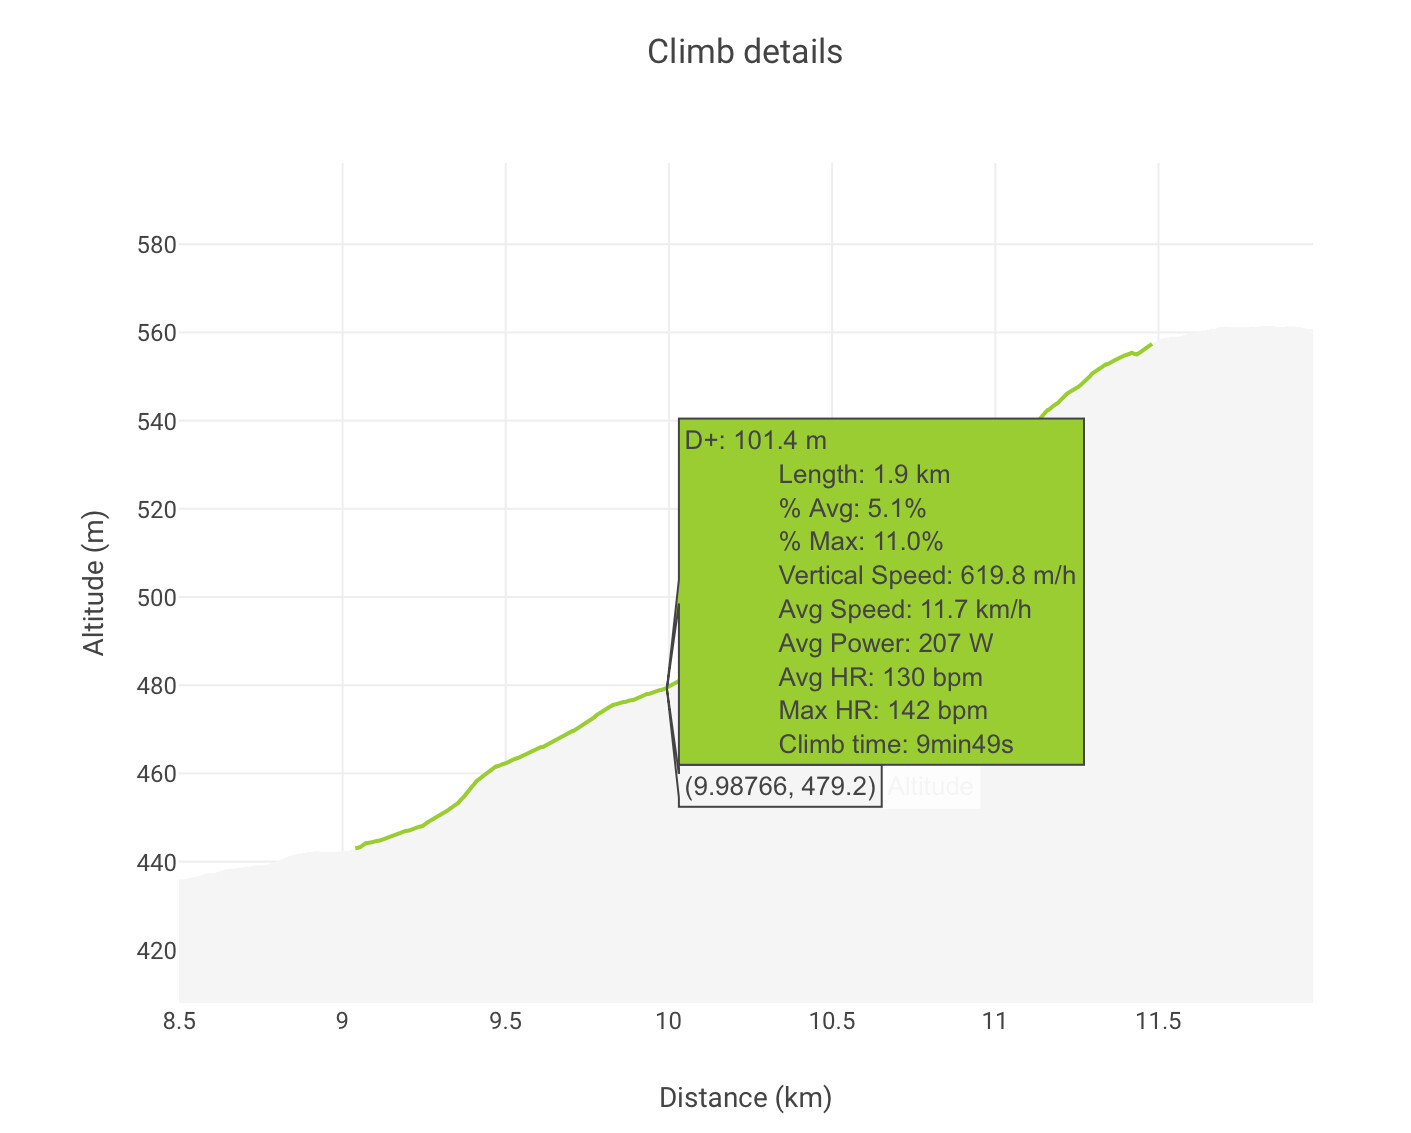
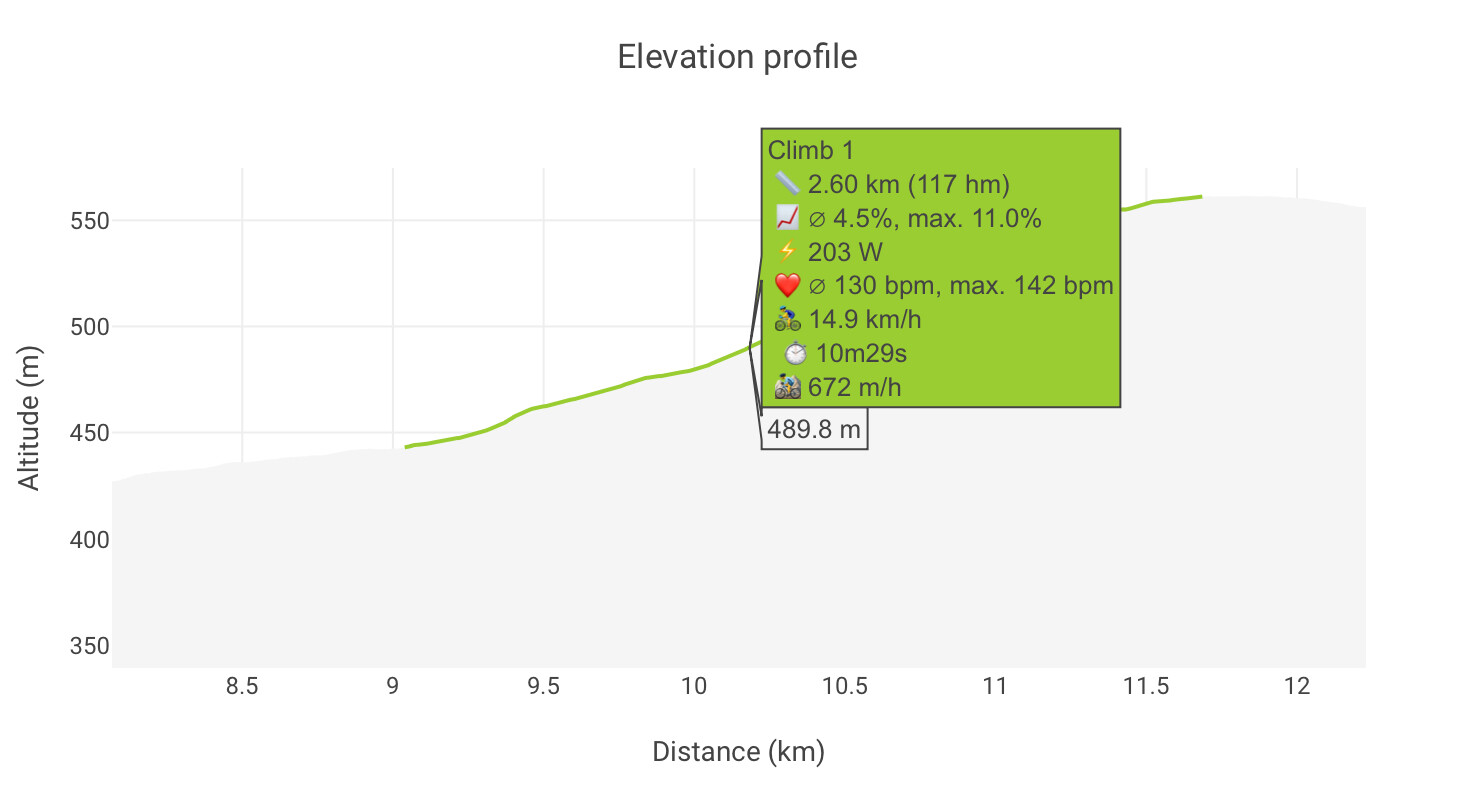
The climb starts at kilometer 9.1 and ends at kilometer 11.5, making it 2.4 kilometers long. However, some details are inaccurate. For instance, the elevation gain (D+) from 440 m to 560 m is actually 120 m, not 101 m. This discrepancy arises because smaller climbs are combined into one larger climb, ignoring the flat sections in between.
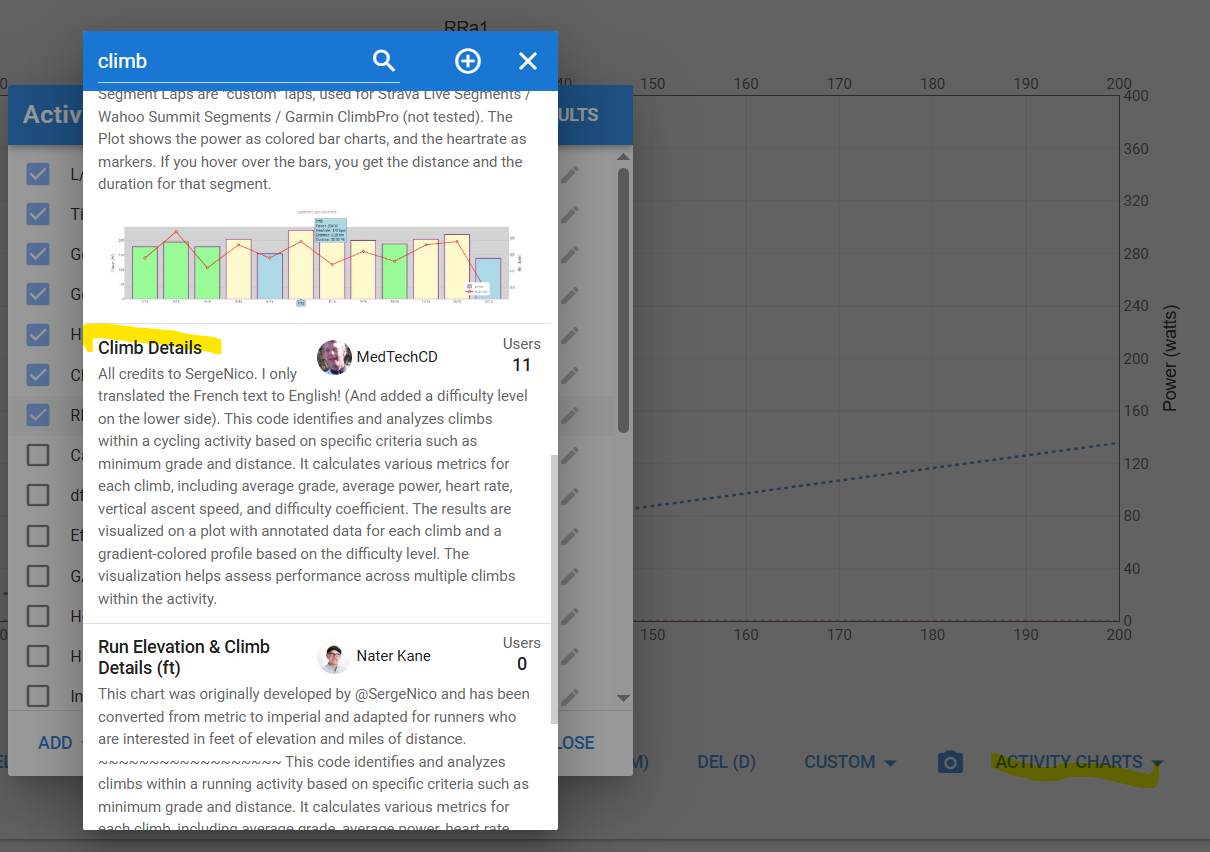
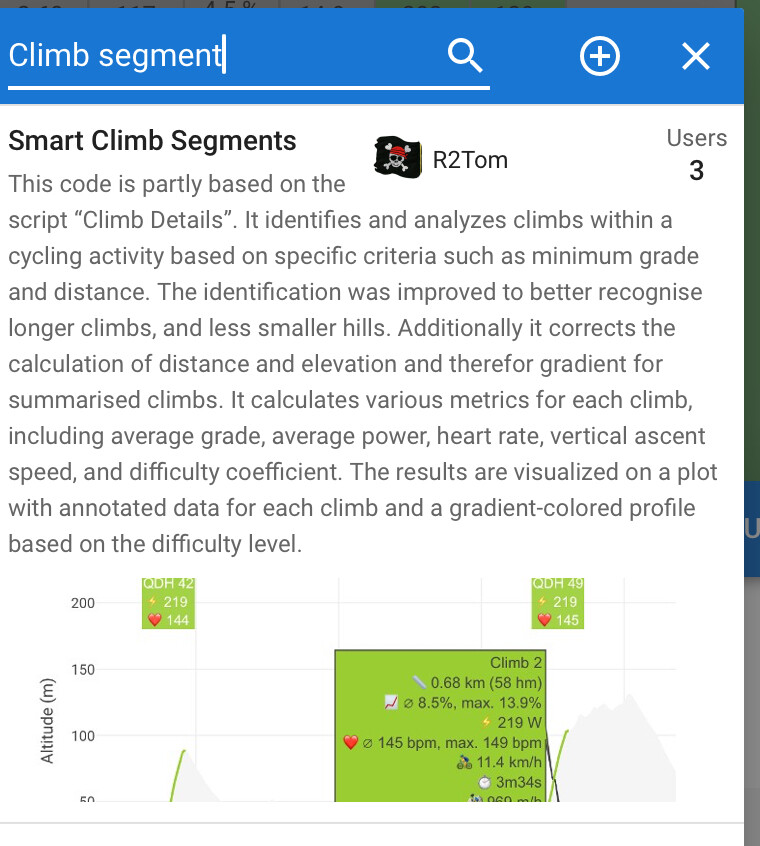
Big thanks to Serge for creating that and @MedTechCD for the translation! I adopted the idea of showing detailed segment information by hovering over the chart and made the necessary corrections. However, the hill detection system works slightly differently, so the segments it generates won’t exactly match the originals. Still, it shows the “correct” values for the segments.
You can take a look, if you search for “Climb Segment”
1 Like
Ah, forgot to translate. It´s indeed altitude gain, from Denivellation in French.
1 Like
Found it, @R2Tom thanks for the adaptation. I’m going to find this so useful.
I also have made a copy of SergeNico’s chart that I made a few changes to, firstly I modified it for runners, converted to US Imperial units (for the most part), changed to english, minor layout changes. etc.
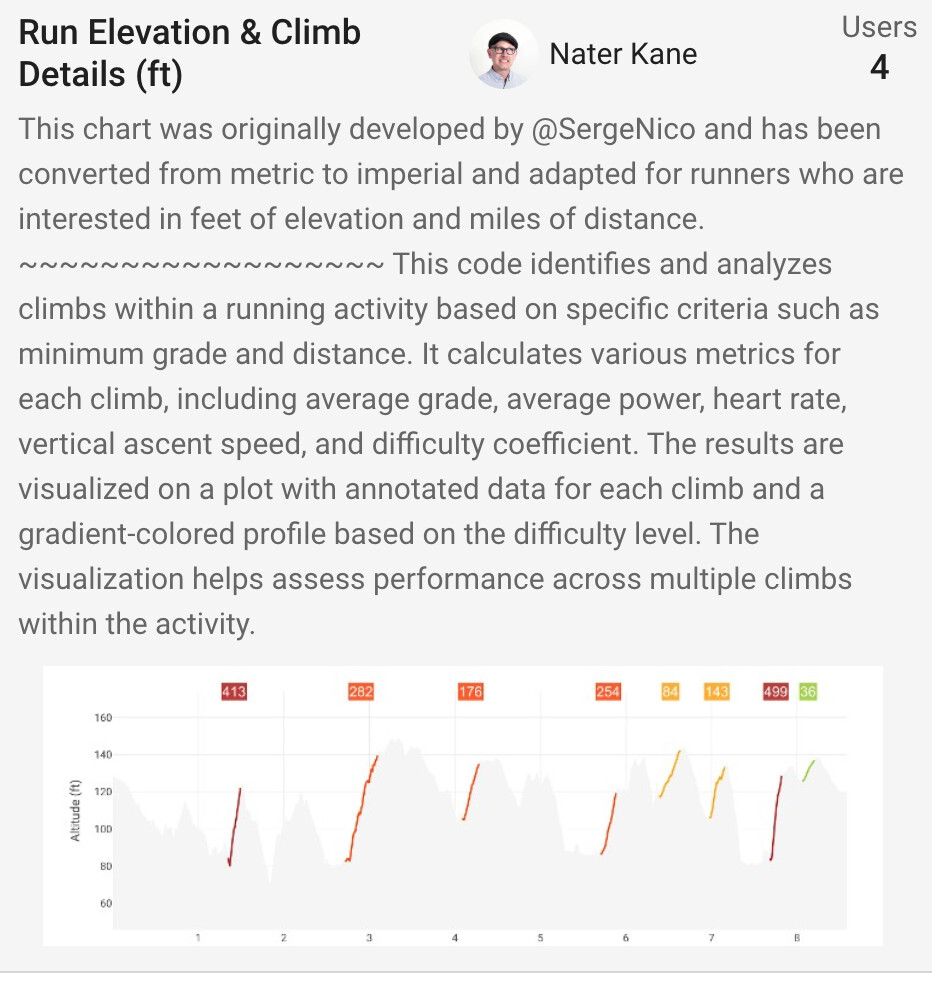
I simply sent him a direct message to thank him, as well as ask for his consent to publish my version.
2 Likes
@R2Tom I’m using your smart climb chart and trying to customize it a bit. I added best 5" to the “avg watt” line, and now I’d like to include W/kg and color the climbs based on zones (e.g. avg watt / FTP). However, it doesn’t work — the chart doesn’t seem to recognize activity.icu_ftp or activity.icu_weight. I also tried wellness.icu_weight, but no luck. I couldn’t find the correct syntax in the forum. Do you know what the right variable names are?
These should be:
icu.activity.icu_ftp
icu.activity.icu_weight
1 Like
this works, many thanks
1 Like
What I’d like to know is if there is a way to create my own segments and have them show up each time I do one. Case in point, I did the Unlocked race this morning, which means four times up the Clyde Kicker Reverse. I then marked off that segment for the first climb, getting it as close to the start and finish as I could. What I would like to do is then be able to have intervals.icu recognize the next three times up the same climb, rather than me having to create three new segments. Is there a way to do this?
1 Like
I would dare say that this would be similar to Strava segments which they patented and is currently in litigation with Garmin.
Having said that. Since I’m no lawyer, I do wonder if based on the patent, from what I read. The patent is based on matching a SERIES of gps points to tiles so that they match the route.
But what you’re looking at is possibly simpler than that. Prev Garmin has a feature called Lap By (GPS) Position. Meaning - user lists a list of gps points where they want a lap mark to be. This will give you - instead of heuristics, just a lap point. (Same line you mark a lap by manually pressing the lap button)
I have made a chart that automatically detects climbs and classifies them into the appropriate categories. For each identified climb, it provides all key metrics, including climb length, average gradient, average power output, and more. The chart also includes a legend that explains the climb category based on the calculated score. In addition, the lowest and highest points of the route are clearly highlighted. A ride summary is displayed alongside the chart for a comprehensive overview of the activity. The interface supports both light and dark modes, depending on the theme selected in the lower section of the left sidebar of the website.
3 Likes
nice!
I have the problem that sometimes I start my ride without elevation lock so the chart starts with a fake climb from 0m
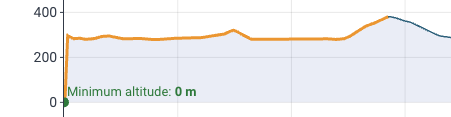
I asked Claude to fix this for me, here is the code if anyone has the same issue as me
{
const THEME_FALLBACK = 'dark';
// ─── THEME AUTO-DETECTION ─────────────────────────────────────
const THEME_MODE = typeof icu.darkMode === 'boolean'
? (icu.darkMode ? 'dark' : 'light')
: (window.matchMedia?.('(prefers-color-scheme: dark)').matches ? 'dark' : 'light')
|| THEME_FALLBACK;
// ─── THEME DEFINITIONS ────────────────────────────────────────
const THEMES = {
dark: {
paper_bgcolor: '#1a1a1a',
plot_bgcolor: '#1a1a1a',
font_color: 'rgba(255,255,255,0.70)',
title_color: 'rgba(255,255,255,0.70)',
axis_color: 'rgba(255,255,255,0.70)',
grid_color: 'rgba(255,255,255,0.06)',
base_line: '#b9ddff',
base_fill: 'rgba(80, 170, 255, 0.10)',
max_point: '#ff5577',
min_point: '#00ff99',
start_point: '#00ff99',
stop_point: '#ff5577',
annotation: 'rgba(255,255,255,0.75)',
hover_border: 'rgba(255,255,255,0.22)',
summary: '#00c3ff',
legend: '#00c3ff',
hover_sum: 'rgba(255, 255, 255, 0.70)',
hover_sum_t: '#ffffff',
hover_climb: 'rgba(255, 255, 255, 0.70)',
hover_climb_t: '#ffffff',
climb_hc: '#ffffff',
climb_cat1: '#ff4d4d',
climb_cat2: '#ffb347',
climb_cat3: '#b6ff5b',
climb_cat4: '#4dff88',
climb_cat5: '#008deb',
climb_uncat: '#c084fc'
},
light: {
paper_bgcolor: '#ffffff',
plot_bgcolor: '#ffffff',
font_color: '#1f2937',
title_color: '#1f2937',
axis_color: '#374151',
grid_color: 'rgba(0,0,0,0.09)',
base_line: '#276c88',
base_fill: 'rgba(30, 64, 175, 0.09)',
max_point: '#e11d48',
min_point: '#0d883a',
start_point: '#0d883a',
stop_point: '#e11d48',
annotation: '#1f2937',
hover_border: 'rgba(0,0,0,0.20)',
summary: '#006159',
legend: '#006159',
hover_sum: 'rgba(0, 0, 0, 0.70)',
hover_sum_t: '#000000',
hover_climb: 'rgba(0, 0, 0, 0.70)',
hover_climb_t: '#000000',
climb_hc: '#1f2937',
climb_cat1: '#e11d48',
climb_cat2: '#f59e0b',
climb_cat3: '#84cc16',
climb_cat4: '#00af5d',
climb_cat5: '#3b82f6',
climb_uncat: '#a855f7'
}
};
const T = THEMES[THEME_MODE] || THEMES['dark'];
// ─── CONFIGURATION ───────────────────────────────────────────
const SECTION_LENGTH = 10;
const MAX_GAP_SEGMENTS = 15;
const MIN_CLIMB_ELEVATION = 20;
const MIN_DIFFICULTY = 1500;
const TREND_WINDOW = 10;
const START_GRADE = 2.0;
const END_GRADE = 0.5;
const MAX_FLAT_DISTANCE_SHORT = 135;
const MAX_FLAT_DISTANCE_LONG = 2000;
const CLIMB_ELEVATION_THRESHOLD = 200;
const MAX_DROP_RATIO = 0.12;
const MIN_DROP_ABS = 10;
const MIN_START_GRADE_STRICT = 2.5;
const START_REFINEMENT_DISTANCE = 100;
const MIN_INTERNAL_GRADE = 2.0;
const INTERNAL_CHECK_DISTANCE = 250;
const MIN_PADDING_RATIO = 0.06;
const MAX_PADDING_RATIO = 0.08;
// ─── HELPER FUNCTIONS ────────────────────────────────────────
function formatTime(seconds) {
if (seconds < 60) return `${Math.floor(seconds)}s`;
if (seconds < 3600) {
const m = Math.floor(seconds / 60);
const s = Math.floor(seconds % 60);
return `${m}m ${s}s`;
}
const h = Math.floor(seconds / 3600);
const m = Math.floor((seconds % 3600) / 60);
const s = Math.floor(seconds % 60);
return `${h}h ${m}m ${s}s`;
}
function cleanAltitudeSpikes(altitudeData) {
const cleaned = [...altitudeData];
const MAX_DELTA = 50;
for (let i = 1; i < cleaned.length - 1; i++) {
const prev = cleaned[i - 1];
const curr = cleaned[i];
const next = cleaned[i + 1];
if (Math.abs(curr - prev) > MAX_DELTA && Math.abs(curr - next) > MAX_DELTA) {
cleaned[i] = (prev + next) / 2;
}
}
return cleaned;
}
function smooth(data, windowSize = 7) {
const result = [];
const half = Math.floor(windowSize / 2);
for (let i = 0; i < data.length; i++) {
let sum = 0;
let count = 0;
for (let j = -half; j <= half; j++) {
const idx = i + j;
if (idx >= 0 && idx < data.length) {
sum += data[idx];
count++;
}
}
result.push(sum / count);
}
return result;
}
function hasValidStream(streamName) {
const stream = icu.streams.get(streamName);
return stream && Array.isArray(stream.data) && stream.data.some(v => v != null);
}
function getStreamData(streamName) {
const stream = icu.streams.get(streamName);
return stream && stream.data
? stream.data.map(v => v ?? 0)
: Array(icu.streams.get("time").data.length).fill(0);
}
function computeGrade(i1, i2) {
const d = distance[i2] - distance[i1];
if (d <= 0) return 0;
return ((altitude[i2] - altitude[i1]) / d) * 100;
}
function getTrendGrade(sectionIndex) {
let dist = 0, elev = 0;
for (let i = sectionIndex; i >= 0; i--) {
dist += sections[i].distance;
elev += sections[i].elevation;
if (dist >= TREND_WINDOW / 2) break;
}
dist = 0;
for (let i = sectionIndex + 1; i < sections.length; i++) {
dist += sections[i].distance;
elev += sections[i].elevation;
if (dist >= TREND_WINDOW / 2) break;
}
return dist > 0 ? (elev / dist) * 100 : 0;
}
function refineClimbStart(startSegment, endSegment) {
let currentSegment = startSegment;
while (currentSegment < endSegment) {
let dist = 0, elev = 0;
let i = currentSegment;
while (i < sections.length && dist < START_REFINEMENT_DISTANCE) {
dist += sections[i].distance;
elev += sections[i].elevation;
i++;
}
if (dist === 0) break;
const avgGrade = (elev / dist) * 100;
if (avgGrade < MIN_START_GRADE_STRICT) {
currentSegment++;
} else {
break;
}
}
return currentSegment;
}
function formatThousands(n) {
return Math.round(n).toString().replace(/\B(?=(\d{3})+(?!\d))/g, '.');
}
// ─── STREAMS ─────────────────────────────────────────────────
let altitudeRaw = hasValidStream("Altitude") ? getStreamData("Altitude") : getStreamData("fixed_altitude");
altitudeRaw = cleanAltitudeSpikes(altitudeRaw);
let gradeRaw = getStreamData("grade_smooth");
let distance = getStreamData("distance");
let power = getStreamData("fixed_watts");
let heartrate = getStreamData("fixed_heartrate");
let time = getStreamData("time");
let cadence = hasValidStream("cadence") ? getStreamData("cadence") : Array(time.length).fill(0);
let speed = hasValidStream("velocity_smooth") ? getStreamData("velocity_smooth") : Array(time.length).fill(0);
// ─── TRIM LEADING INVALID ALTITUDE SAMPLES ───────────────────
// At the start of some activities the GPS hasn't locked yet and
// altitude is 0 (or near-zero) for the first few seconds.
// Find the first index where ALT_WINDOW consecutive samples are
// all above ALT_MIN_VALID, then slice every stream from that point
// so all arrays stay perfectly aligned.
{
const ALT_MIN_VALID = 5; // metres — at or below = not yet locked
const ALT_WINDOW = 3; // consecutive valid samples required
let trimStart = 0;
for (let i = 0; i <= altitudeRaw.length - ALT_WINDOW; i++) {
const windowOk = Array.from({ length: ALT_WINDOW }, (_, k) => altitudeRaw[i + k])
.every(v => v > ALT_MIN_VALID);
if (windowOk) { trimStart = i; break; }
}
if (trimStart > 0) {
altitudeRaw = altitudeRaw.slice(trimStart);
gradeRaw = gradeRaw.slice(trimStart);
distance = distance.slice(trimStart);
power = power.slice(trimStart);
heartrate = heartrate.slice(trimStart);
time = time.slice(trimStart);
cadence = cadence.slice(trimStart);
speed = speed.slice(trimStart);
}
}
const altitude = smooth(altitudeRaw, 15);
const grade = smooth(gradeRaw, 15);
const distanceKm = distance.map(d => d / 1000);
const minX = 0;
const maxX = Math.max(...distanceKm);
// ─── SECTIONS ────────────────────────────────────────────────
let sections = [];
let currentStartIndex = 0;
for (let i = 1; i < distance.length; i++) {
const distDiff = distance[i] - distance[currentStartIndex];
if (distDiff >= SECTION_LENGTH || i === distance.length - 1) {
const altDiff = altitude[i] - altitude[currentStartIndex];
const realGrade = computeGrade(currentStartIndex, i);
sections.push({
sectionIndex: sections.length,
startIndex: currentStartIndex,
endIndex: i,
distance: distDiff,
elevation: altDiff,
grade: realGrade
});
currentStartIndex = i;
}
}
// ─── CLIMB DETECTION ─────────────────────────────────────────
let climbs = [];
let currentClimb = null;
let flatDistance = 0;
let totalAscent = 0;
let highestAltitude = 0;
let highestSegmentIndex = null;
const minSegmentsDynamic = Math.max(5, Math.floor(200 / SECTION_LENGTH));
sections.forEach((section, index) => {
const trend = getTrendGrade(index);
const currentAlt = altitude[section.endIndex];
if (!currentClimb && trend >= START_GRADE) {
currentClimb = { startSegment: section.sectionIndex };
flatDistance = 0;
totalAscent = 0;
highestAltitude = currentAlt;
highestSegmentIndex = section.sectionIndex;
return;
}
if (!currentClimb) return;
if (section.elevation > 0) totalAscent += section.elevation;
if (currentAlt > highestAltitude) {
highestAltitude = currentAlt;
highestSegmentIndex = section.sectionIndex;
}
const dropFromPeak = highestAltitude - currentAlt;
const tooMuchDrop = totalAscent > 0 && (dropFromPeak > totalAscent * MAX_DROP_RATIO && dropFromPeak > MIN_DROP_ABS);
if (trend >= END_GRADE && !tooMuchDrop) {
flatDistance = 0;
} else {
flatDistance += section.distance;
}
const maxFlatForCurrentClimb = totalAscent >= CLIMB_ELEVATION_THRESHOLD ? MAX_FLAT_DISTANCE_LONG : MAX_FLAT_DISTANCE_SHORT;
const tooLongFlat = flatDistance > maxFlatForCurrentClimb;
const isLast = index === sections.length - 1;
if (tooLongFlat || tooMuchDrop || isLast) {
const endSegment = highestSegmentIndex;
const climbElevation = altitude[sections[endSegment].endIndex] - altitude[sections[currentClimb.startSegment].startIndex];
if (endSegment > currentClimb.startSegment && endSegment - currentClimb.startSegment >= minSegmentsDynamic && climbElevation >= MIN_CLIMB_ELEVATION) {
climbs.push({ startSegment: currentClimb.startSegment, endSegment: endSegment });
}
currentClimb = null;
}
});
// Merge close climbs
for (let i = 1; i < climbs.length; i++) {
const prev = climbs[i - 1];
const curr = climbs[i];
const gapElevation = altitude[sections[curr.startSegment].startIndex] - altitude[sections[prev.endSegment].endIndex];
if (curr.startSegment - prev.endSegment <= MAX_GAP_SEGMENTS && gapElevation > -15) {
prev.endSegment = curr.endSegment;
climbs.splice(i, 1);
i--;
}
}
// ─── TRACES & ANNOTATIONS ────────────────────────────────────
let traces = [];
let climbNo = 0;
const minAlt = Math.min(...altitude);
const maxAlt = Math.max(...altitude);
const range = maxAlt - minAlt;
const FORCE_Y_LIMIT = 350;
let yMin = minAlt - range * MIN_PADDING_RATIO;
let yMax = maxAlt + range * MAX_PADDING_RATIO;
if (maxAlt <= FORCE_Y_LIMIT) {
yMin = Math.max(0, minAlt - range * 0.15);
yMax = FORCE_Y_LIMIT;
}
// ─── ELEVATION GAIN ──────────────────────────────────────────
let totalElevationGain = icu.activity?.total_elevation_gain
?? icu.activity?.elev_gain
?? icu.activity?.totalElevationGain;
if (!totalElevationGain || totalElevationGain < 50) {
totalElevationGain = altitudeRaw.reduce((sum, h, i) => {
if (i === 0) return 0;
const diff = h - altitudeRaw[i - 1];
return diff > 0 ? sum + diff : sum;
}, 0);
}
const avgHR = heartrate.reduce((a, b) => a + b, 0) / heartrate.length;
const avgSpeed = (speed.reduce((a, b) => a + b, 0) / speed.length) * 3.6;
const validCadence = cadence.filter(c => c > 0);
const avgPower = power.reduce((a, b) => a + b, 0) / power.length;
const avgCadence = validCadence.length ? validCadence.reduce((a, b) => a + b, 0) / validCadence.length : 0;
climbs.forEach(climb => {
const refinedStart = refineClimbStart(climb.startSegment, climb.endSegment);
const startIndex = sections[refinedStart].startIndex;
const endIndex = sections[climb.endSegment].endIndex;
const climbSections = sections.slice(refinedStart, climb.endSegment + 1);
const totalDist = climbSections.reduce((s, x) => s + x.distance, 0);
const totalElev = climbSections.reduce((s, x) => s + x.elevation, 0);
let effectiveDist = 0, effectiveElevForGrade = 0;
let windowDist = 0, windowElev = 0;
for (let i = 0; i < climbSections.length; i++) {
windowDist += climbSections[i].distance;
windowElev += climbSections[i].elevation;
if (windowDist >= INTERNAL_CHECK_DISTANCE) {
const avgGrade = (windowElev / windowDist) * 100;
if (avgGrade >= MIN_INTERNAL_GRADE) {
effectiveDist += windowDist;
effectiveElevForGrade += windowElev;
}
windowDist = 0;
windowElev = 0;
}
}
if (effectiveDist === 0) {
effectiveDist = totalDist;
effectiveElevForGrade = totalElev;
}
const climbElevation = altitude[endIndex] - altitude[startIndex];
const climbDistance = totalDist;
const avgGrade = climbDistance > 0 ? (climbElevation / climbDistance) * 100 : 0;
const score = totalDist * avgGrade;
if (score < MIN_DIFFICULTY || score < 1500) return;
climbNo++;
let category = "UNCATEGORIZED";
let bgColor = T.climb_uncat;
if (score >= 80000) { category = "HC"; bgColor = T.climb_hc; }
else if (score >= 64000) { category = "1<sup>st</sup> CATEGORY"; bgColor = T.climb_cat1; }
else if (score >= 32000) { category = "2<sup>nd</sup> CATEGORY"; bgColor = T.climb_cat2; }
else if (score >= 16000) { category = "3<sup>rd</sup> CATEGORY"; bgColor = T.climb_cat3; }
else if (score >= 8000) { category = "4<sup>th</sup> CATEGORY"; bgColor = T.climb_cat4; }
else if (score >= 3000) { category = "5<sup>th</sup> CATEGORY"; bgColor = T.climb_cat5; }
const climbTime = time[endIndex] - time[startIndex];
const climbPowers = power.slice(startIndex, endIndex);
const climbHR = heartrate.slice(startIndex, endIndex);
const climbCadence = cadence.slice(startIndex, endIndex);
const climbSpeed = speed.slice(startIndex, endIndex);
const avgPowerClimb = climbPowers.reduce((a, b) => a + b, 0) / climbPowers.length;
const avgHRClimb = climbHR.reduce((a, b) => a + b, 0) / climbHR.length;
const avgCadenceClimb = climbCadence.length ? climbCadence.reduce((a, b) => a + b, 0) / climbCadence.length : 0;
const maxHR = Math.max(...climbHR);
const maxCAD = Math.max(...climbCadence);
const avgSpeedClimb = climbSpeed.length ? (climbSpeed.reduce((a, b) => a + b, 0) / climbSpeed.length) * 3.6 : 0;
const np = Math.pow(climbPowers.reduce((s, p) => s + Math.pow(p, 4), 0) / climbPowers.length, 1 / 4);
const maxGrade = Math.max(...grade.slice(startIndex, endIndex));
const vam = climbTime > 0 ? ((altitude[endIndex] - altitude[startIndex]) / climbTime) * 3600 : 0;
traces.push({
x: distanceKm.slice(startIndex, endIndex),
y: altitude.slice(startIndex, endIndex),
type: 'scatter',
mode: 'lines',
line: { color: bgColor, width: 3 },
name: `Climb ${climbNo}`,
hovertemplate: `<span style="color: ${T.hover_clim_t};font-weight:600;letter-spacing:0.2px;">${category} CLIMB<br></span>` +
`<span style="color:${bgColor}">Score:</span> <span style="color: ${T.hover_climb}">${formatThousands(score)}<br></span>` +
`<span style="color:${bgColor}">Time:</span> <span style="color: ${T.hover_climb}">${formatTime(climbTime)}<br></span>` +
`<span style="color:${bgColor}">Distance:</span> <span style="color: ${T.hover_climb}">${totalDist < 1000 ? `${totalDist.toFixed(0)} m` : `${(totalDist / 1000).toFixed(2)} km`} (${climbElevation.toFixed(0)} Vm)<br></span>` +
`<span style="color:${bgColor}">VAM:</span> <span style="color: ${T.hover_climb}">${vam.toFixed(0)} Vm/h<br></span>` +
`<span style="color:${bgColor}">Speed:</span> <span style="color: ${T.hover_climb}">${avgSpeedClimb.toFixed(1)} km/h<br></span>` +
`<span style="color:${bgColor}">Power:</span> <span style="color: ${T.hover_climb}">${avgPowerClimb.toFixed(0)} W (NP ${np.toFixed(0)} W)<br></span>` +
`<span style="color:${bgColor}">Cadence:</span> <span style="color: ${T.hover_climb}">${avgCadenceClimb.toFixed(0)} rpm (max. ${maxCAD.toFixed(0)})<br></span>` +
`<span style="color:${bgColor}">HR:</span> <span style="color: ${T.hover_climb}">${avgHRClimb.toFixed(0)} bpm (max. ${maxHR.toFixed(0)} bpm)<br></span>` +
`<span style="color:${bgColor}">Grade:</span> <span style="color: ${T.hover_climb}">${avgGrade.toFixed(1)} % (max. ${maxGrade.toFixed(1)} %)<extra></extra></span>`
});
});
// Base profile
traces.unshift({
x: distanceKm,
y: altitude,
type: 'scatter',
mode: 'lines',
fill: 'tozeroy',
fillcolor: T.base_fill,
line: {
color: T.base_line,
width: 1.5,
shape: 'spline',
smoothing: 1.0
},
hoverinfo: 'text',
name: 'Profil',
text: distanceKm.map((d, i) =>
`<span style="color: ${T.hover_sum_t}">Time:</span> <span style="color: ${T.hover_sum}">${formatTime(time[i])}<br></span>` +
`<span style="color: ${T.hover_sum_t}">Distance:</span> <span style="color: ${T.hover_sum}">${d.toFixed(2)} km<br></span>` +
`<span style="color: ${T.hover_sum_t}">Grade:</span> <span style="color: ${T.hover_sum}">${grade[i].toFixed(0)} %<br></span>` +
`<span style="color: ${T.hover_sum_t}">Altitude:</span> <span style="color: ${T.hover_sum}">${altitude[i].toFixed(0)} m</span>`
)
});
// Max / Min / Start / Stop points
const maxAltIndex = altitude.indexOf(maxAlt);
const minAltIndex = altitude.indexOf(minAlt);
traces.push({ x: [distanceKm[maxAltIndex]], y: [maxAlt + range * 0.009], type: 'scatter', mode: 'markers', marker: { size: 7, color: T.max_point, symbol: 'triangle-down' }, hoverinfo: 'skip' });
traces.push({ x: [distanceKm[minAltIndex]], y: [minAlt + range * 0.009], type: 'scatter', mode: 'markers', marker: { size: 7, color: T.min_point, symbol: 'triangle-down' }, hoverinfo: 'skip' });
traces.push({ x: [minX], y: [altitude[0]], type: 'scatter', mode: 'markers', marker: { size: 10, color: T.start_point, symbol: 'circle' }, hoverinfo: 'skip' });
traces.push({ x: [maxX], y: [altitude[altitude.length - 1]], type: 'scatter', mode: 'markers', marker: { size: 10, color: T.stop_point, symbol: 'circle' }, hoverinfo: 'skip' });
let dtickValue;
const yRange = yMax - yMin;
if (maxAlt <= FORCE_Y_LIMIT) {
if (yRange > 250) {
dtickValue = 50;
} else {
dtickValue = 25;
}
} else {
if (yRange > 1500) {
dtickValue = 500;
} else if (yRange > 800) {
dtickValue = 200;
} else if (yRange > 400) {
dtickValue = 100;
} else if (yRange > 200) {
dtickValue = 50;
} else {
dtickValue = 25;
}
}
dtickValue = Math.max(25, Math.round(dtickValue / 25) * 25);
// Layout
layout = {
title: {
text: 'Climb Analysis',
font: { color: T.title_color, size: 18 }
},
paper_bgcolor: T.paper_bgcolor,
plot_bgcolor: T.plot_bgcolor,
font: { color: T.font_color, size: 14 },
margin: { t: 120, b: 45, l: 60, r: 10 },
hoverlabel: {
font: { color: THEME_MODE === 'dark' ? "white" : "#1f2937", size: 13 },
bgcolor: T.paper_bgcolor,
bordercolor: T.hover_border
},
xaxis: {
title: { text: 'Distance [km]', font: { size: 14, color: T.axis_color } },
color: T.axis_color,
tickcolor: T.axis_color,
linecolor: T.axis_color,
gridcolor: T.grid_color,
range: [minX, maxX],
ticks: 'outside',
ticklen: 3,
tickwidth: 0.5,
tickmode: "array",
tickvals: [...Array.from({length: Math.floor(maxX/5)+1}, (_,i)=>i*5)],
ticktext: [...Array.from({length: Math.floor(maxX/5)+1}, (_,i)=> (i*5).toFixed(0))],
showline: true,
showgrid: true,
zeroline: false
},
yaxis: {
title: { text: 'Altitude [m]', font: { size: 14, color: T.axis_color } },
color: T.axis_color,
tickcolor: T.axis_color,
linecolor: T.axis_color,
gridcolor: T.grid_color,
range: [yMin, yMax],
ticks: 'outside',
ticklen: 3,
tickwidth: 0.5,
tickmode: "linear",
dtick: dtickValue,
showline: true,
showgrid: true,
zeroline: false
},
annotations: [
{
x: 0.5, y: 1.12, xref: "paper", yref: "paper",
showarrow: false, align: "center",
font: { size: 12, color: T.annotation },
text: `<b><span style='color:${T.legend}; font-size: 15px;'>Climb categories (score): </span></b>` +
`<span style='color:${T.climb_hc}'>HC (> 80.000)</span> | ` +
`<span style='color:${T.climb_cat1}'>Cat 1 (64.000-80.000)</span> | ` +
`<span style='color:${T.climb_cat2}'>Cat 2 (32.000-64.000)</span> | ` +
`<span style='color:${T.climb_cat3}'>Cat 3 (16.000-32.000)</span> | ` +
`<span style='color:${T.climb_cat4}'>Cat 4 (8.000-16.000)</span> | ` +
`<span style='color:${T.climb_cat5}'>Cat 5 (3.000-8.000)</span> | ` +
`<span style='color:${T.climb_uncat}'>Uncategorized (1.500-3.000)</span>`
},
{
x: 0, y: 1.35, xref: "paper", yref: "paper",
xanchor: "left", yanchor: "top",
showarrow: false, align: "left",
font: { size: 12.5, color: T.annotation },
text: `<b><span style='color: ${T.summary}; font-size: 15px;'>Ride summary</span></b><br>` +
`Distance: ${(maxX).toFixed(2)} km<br>` +
`Elevation gain: ${totalElevationGain.toFixed(0)} m<br>` +
`Avg. power: ${avgPower.toFixed(0)} W<br>` +
`Avg. HR: ${avgHR.toFixed(0)} bpm<br>` +
`Avg. speed: ${avgSpeed.toFixed(1)} km/h<br>` +
`Avg. cadence: ${avgCadence.toFixed(0)} rpm`
}
],
hovermode: 'x unified',
showlegend: false
};
// ─── HORIZONTAL DASHED LINES + CLEAN MIN/MAX LABELS ─────────────
layout.shapes = [
{
type: 'line',
x0: minX, y0: maxAlt, x1: distanceKm[maxAltIndex], y1: maxAlt,
line: { color: T.max_point, width: 1.0, dash: 'dot' },
opacity: 0.65,
layer: 'below'
},
{
type: 'line',
x0: minX, y0: minAlt, x1: distanceKm[minAltIndex], y1: minAlt,
line: { color: T.min_point, width: 1.0, dash: 'dot' },
opacity: 0.65,
layer: 'below'
}
];
layout.annotations.push(
{
xref: 'paper', yref: 'y',
x: 0.001, y: maxAlt,
xanchor: 'left', yanchor: 'bottom', yshift: 3,
text: `Maximum altitude: <b>${maxAlt.toFixed(0)} m</b>`,
font: { color: T.max_point, size: 13 },
showarrow: false
},
{
xref: 'paper', yref: 'y',
x: 0.001, y: minAlt,
xanchor: 'left', yanchor: 'bottom', yshift: 3,
text: `Minimum altitude: <b>${minAlt.toFixed(0)} m</b>`,
font: { color: T.min_point, size: 13 },
showarrow: false
}
);
const result = { data: traces, layout: layout };
result;
}
1 Like
Interesting. This has never happened to me. Thanks for fixing the code Filippo ![]()
1 Like
it’s a problem of the wahoo units
2 Likes
I created something, but am unsure, if this would violate any (hypothetical) patents. But you can run it on your local computer if you like.
It only compares to your own activities, no leaderboard or something. Just comparing a slice of your activity with other, which happened at the same route-slice.
Errors may be implemented, at the moment it is more like a draft
2 Likes